Section 6 Tree mortality
With a warming climate, the Southwest will experience more years of drought. Droughts, in turn, will grow more severe as a warming atmosphere draws more and more water from soil and plants9. As trees experience greater water and heat stress, their resistance to insects and disease decline, and especially for older trees, that means a greater likelihood of dying. Drought and heat related factors have already begun to take effect, raising rates of forest mortality across the western US22 and, indeed, globally with climate change21. Future warming is likely to amplify these patterns, making heat-stress and drought-associated disturbances (like wildfire) more common and more severe15,82. The patterns, causes, and consequences of tree mortality and large-scale die-off events have received substantial attention among researchers in recent years. As summarized by 20, who examined >400 studies world-wide, some key lessons have emerged:
warming increases the severity of drought
mortality occurs more quickly during drought
drought events in the Southwest can last for multiple years or even decades
short-duration droughts are much more common, but can become lethal to trees under warmer conditions
mortality rates can exceed the pace of forest recovery, causing declines in forest health and productivity.
While traveling through Navajo forests conducting fieldwork over the last half-decade, we have noted various instances of tree mortality (Figure 6.1). At times, clumps of dead or dying trees were enough to cause concern over more general patterns regarding forest health. But these observations are not enough to develop sound judgement about a dynamic process like tree mortality. In this section, we present trends and rates of tree mortality from Navajo forest inventory plots and from our three demography study sites. We selected our demography sites to represent some of the oldest stands in the Navajo forest because recent studies suggest that large old trees may be the most vulnerable to reduced growth and increased mortality in a changing climate83,84. Large old trees are also the most rare and hardest to replace trees in the forest, and their benefits may not be fulfilled by smaller trees85. In other words, old-growth forests are a rare and unique resource that deserve preservation and care, and they may also serve as a canary in the coal mine for the broader Navajo forest area, foretelling us of widespread changes to come.
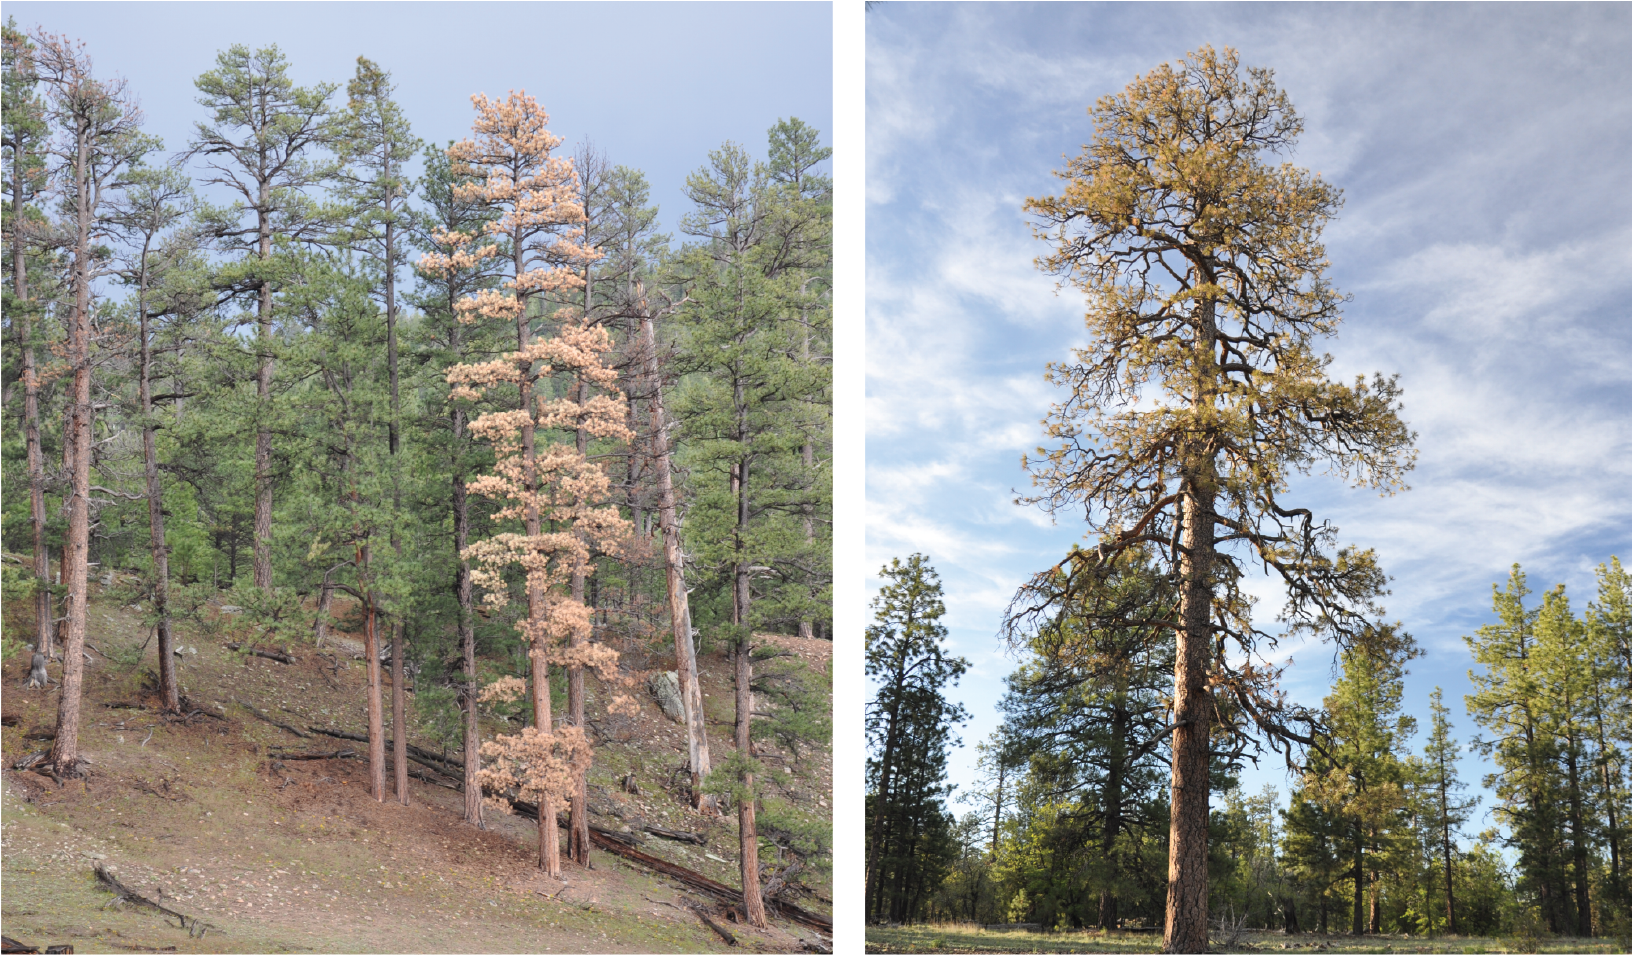
Figure 6.1: Examples of recent tree mortality. At left, old Ponderosa pines in the Lukachukai area of the Chuska Mountains. Four of the trees shown here died 2006-2016. The red-colored tree at center died in 2015. At right, a 400-year old ponderosa pine on the Defiance Plateau. We dated the tree’s germination to 1613, and it died in 2015. The following year it was cut by local tribal members for fuelwood. Photo credit: C. Guiterman.
6.1 What are the rates of tree mortality on the Navajo Nation?
Navajo forests have been measured across a network of Continuous Forest Inventory (CFI) plots since ~1974. The number of plots in each inventory has varied as plots have been added or removed. The year of each inventory depends on a range of factors, with most plots having been re-visited and re-measured three times up to 2004. The complete CFI plot network includes 272 plots, each with three ¼-acre subplots. On the subplots, every tree ≥5 inches diameter at breast height (DBH, 4.5 feet above ground) is measured and permanently marked, so we can track individual trees through time. In 2015, we conducted a sub-sample of 35 CFI plots as part of a project to core trees along a climate gradient (see Tree growth response to climate and 44). As part of our tree-coring protocol, we measured all previously tallied trees on all subplots but did not record new in-growth trees meeting the minimum DBH requirement (5.0 in).
We calculated annual mortality rates for conifer species across each plot at the year of re-measurement, accounting for all trees that survived, died, or were cut, following the methods of 86. In all, there were 16,544 conifer trees tallied across all CFI plots, of which 731 trees died. Annual mortality rates average about 0.36% (se = 0.03%) per year (Table 6.1), though many plots experienced no mortality during individual periods or throughout the full plot inventory (~1974-2004).
| Inventory year | Number of plots | Mortality rate (% per year) | Standard error |
|---|---|---|---|
| 1980 | 175 | 0.363 | 0.064 |
| 1990 | 198 | 0.291 | 0.035 |
| 2004 | 190 | 0.386 | 0.047 |
| 2015 | 35 | 0.585 | 0.148 |
This average mortality rate (~0.36% per year) is very similar and maybe slightly lower than modeled rates for old-growth, un-logged forest reserves of the Interior Western United States during the early 2000s22. Several factors would account for lower mortality rates in Navajo forests, including the possibility of lower-severity drought years in the early 2000s. It is also highly possible that thinning treatments during the 1960s-1980s in Navajo forests helped to offset later tree mortality by removing trees that might otherwise have died more recently. Our estimates of mortality may also be slightly low due to potential miss-classification of trees that died versus were cut, as standing dead trees are an important fuelwood resource for local tribal members. The stumps left behind by fuelwood cutting could have been classified as “cut” during plot inventories and not included in our calculations for the 1980 and 1990 periods. However, we include cut trees for the later periods (2004 and 2015) because there was very limited logging in these forests after 1991 and by we found by assessing the numbers of “cut” trees, that CFI plots are not greatly affected by fuelwood cutting.
The highest rates of conifer mortality on CFI plots appear to be centered in the Chuska Mountains, presumably due to higher levels of tree growth and forest turn-over in upper-elevation stands compared to the lower elevation Defiance Plateau (Figure 6.2). Indeed, areas where multiple plots cluster with higher mortality rates are in the highest-elevation areas of the Chuska Mountains. These include the southern part of the Chuska Crest and in the Lukachukai Mountains area toward the north. Tree mortality on the Defiance Plateau (western area of the maps) is scattered and inconsistent between measurement intervals, reflecting a pattern of sporadic, background mortality rates in relatively old and slow growing stands dominated by ponderosa pine.
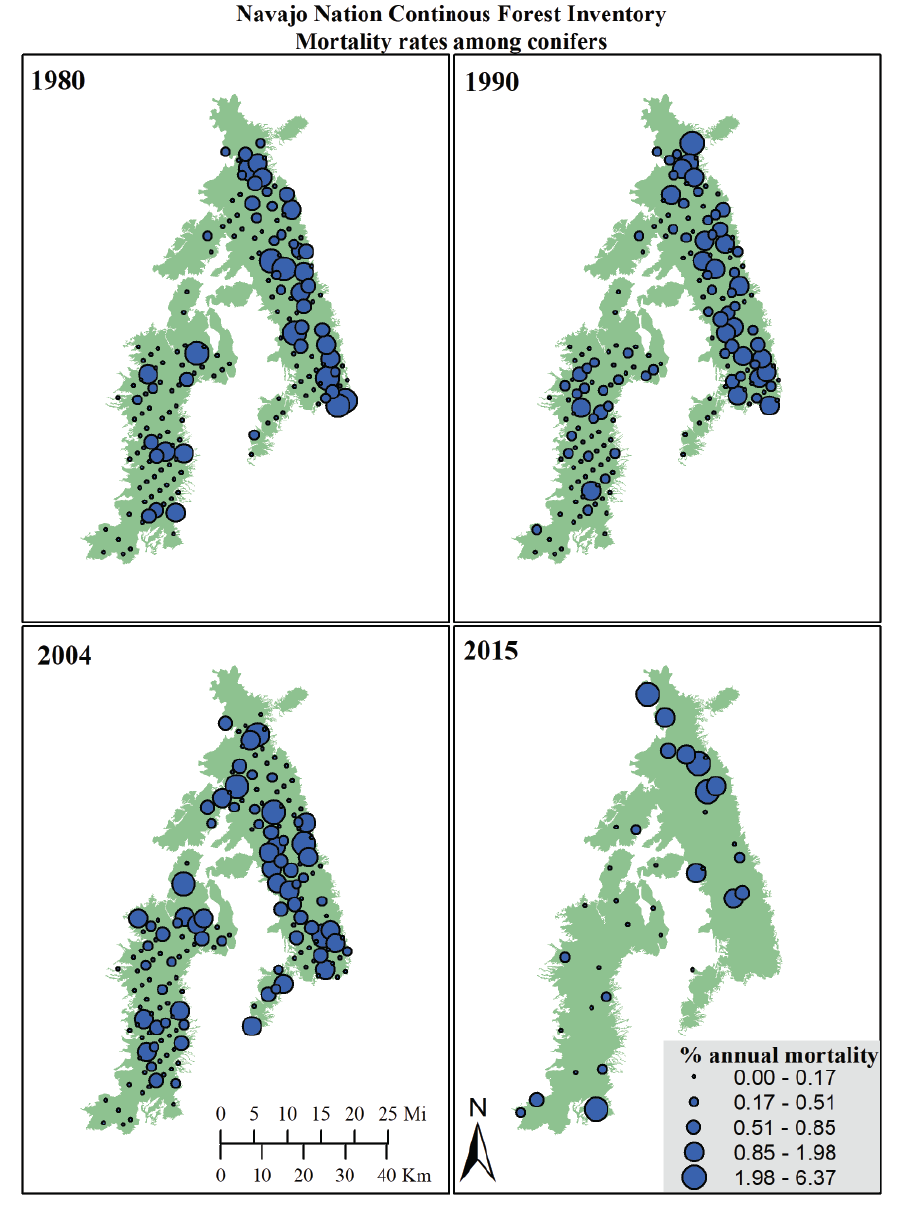
Figure 6.2: Maps of annual conifer mortality rates at CFI plots for each year of plot re-measurement.
6.2 Do old-growth forests have greater mortality rates than the general Navajo forest area?
At our three demography sites, we estimated tree mortality rates based on tree-ring specimens collected from living and dead trees at each of seven plots per site. The precise crossdating of the trees allowed us to reconstruct the same plot-measurement intervals as on CFI plots. We considered all trees surviving each interval, and counted dead trees as all snags, logs, and stumps with an outside ring dating within the 10-15 year interval. We include stumps in this calculation because demography sites were located in areas with very little logging, but that were sometimes used for fuelwood collecting. Wood rot and erosion of the outside of dead trees with time probably makes our estimates of mortality slightly low during earlier inventory periods (e.g., 1980), but this error rate would depreciate toward present as preservation of the wood is better.
Annual mortality at the old-growth demography sites averaged 0.15% per year during 1970-2016. This mortality rate is approximately half of the mortality rate for the CFI plots over an equivalent period. Mortality rates among the demography sites were on the rise from the early period through 2004, when they peak at ~0.2% per year (Figure 6.3). Interestingly, the 1990-2004 period had the lowest mortality rate for CFI plots, and all three demography sites fall within the 95% confidence limits of the CFI plots for that year. This rate of conifer tree mortality (0.2% per year) possibly reflects longer-term background rates of forest mortality on the Navajo Nation, and could be used as a basis for future comparisons as the region grows warmer and drier.
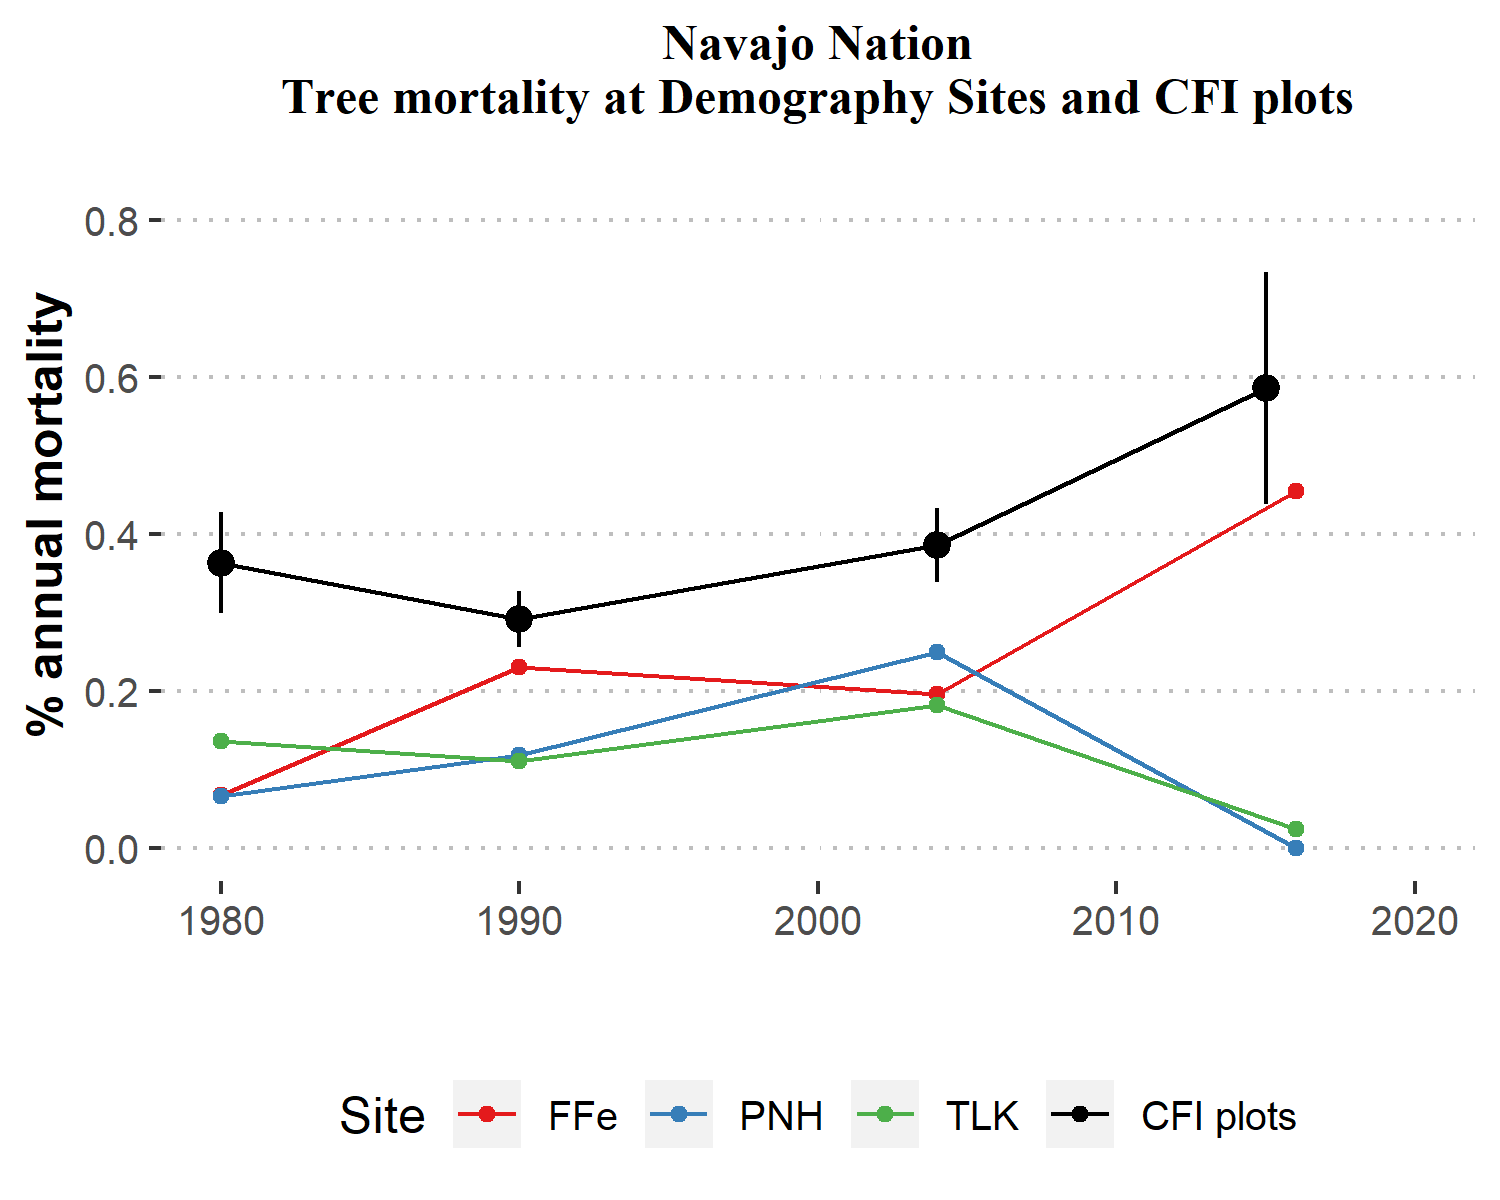
Figure 6.3: Comparison of conifer mortality rates (1980-2016) between Navajo Nation CFI plots and Navajo demography sites. Sites include Falling Irons (FFe), Piney Hill (PNH) and Tohatchi Lookout (TLK). Vertical bars for CFI plots represent 95% confidence intervals.
6.3 Have mortality rates in Navajo forests changed in recent years in response to warming and drought conditions?
Generally speaking, the Southwest has experienced nearly continuous drought conditions since ~1999. During this era, climate change has increased regional average temperatures, making the last decade or so an era of “hotter droughts.” The effects of this drought can be seen in the CFI mortality rates. Until 2004, mortality at individual plots did not substantially grow, but more plots experienced tree mortality than in previous inventories (Figure 6.4). At the 2004 inventory and 2015 sub-sample collection, nearly half of CFI plots recorded above zero mortality rates. The areas where change occurred most clearly include lower elevation stands on the western side of the Chuska Mountains and on the northern end of the Defiance Plateau (Figure 6.2).
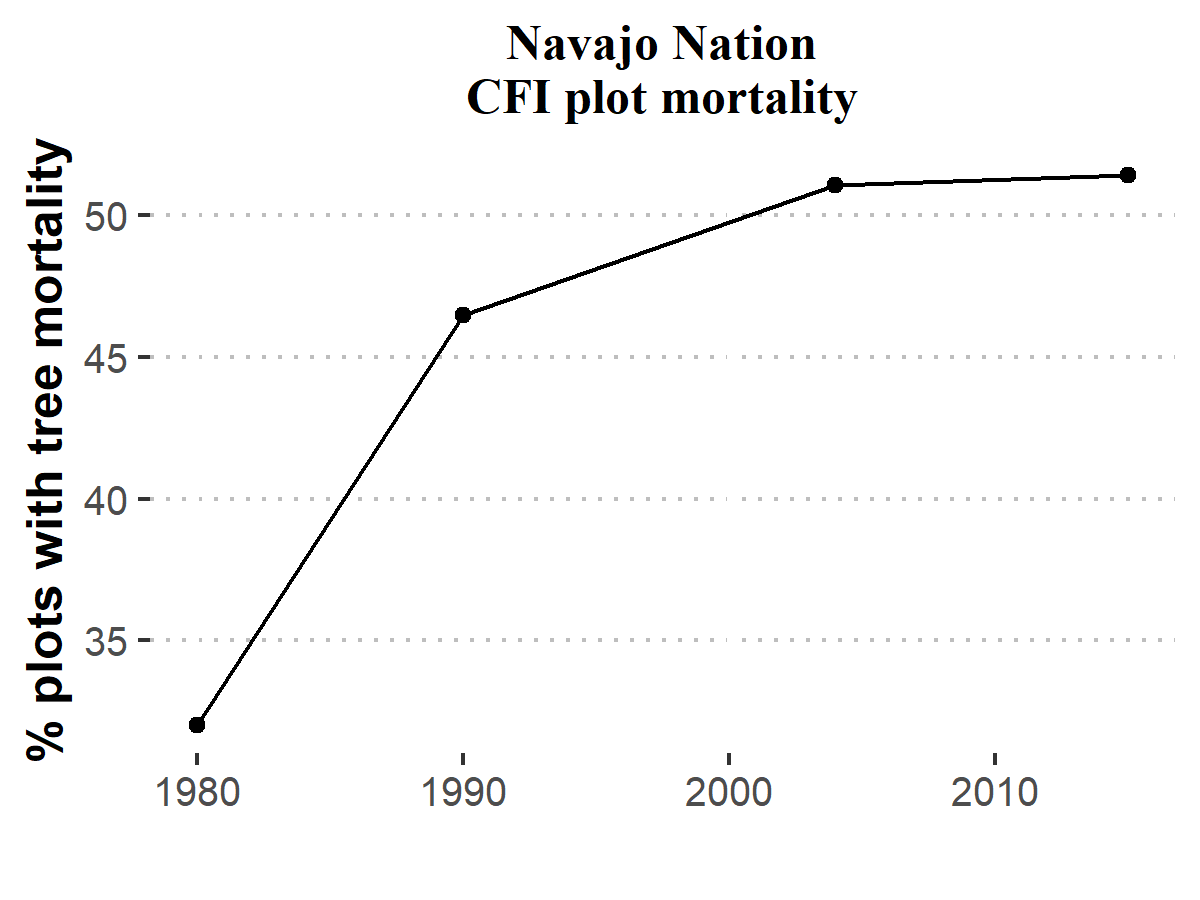
Figure 6.4: The percentage of CFI plots with tree mortality.
From 2004 to 2015, 35 CFI plots record a dramatic increase in mortality (Table 6.1), which is also seen at the demography site at Falling Irons (FFe) (Figure 6.3). The mortality rate at FFe doubled from 2004-2016, and the average mortality rate of CFI plots increased by over 50%. While general mortality rates for Navajo forests remained lower than the Interior West analysis, by the 2004-2016 period, mortality rates for Navajo forests approached those reported by 22 a decade ago. At FFe as on the Chuska Crest, the upper-elevation site includes higher growth rates and thus more turn-over in the forest canopy, resulting in higher average levels of background mortality. However, since the other demography sites decreased in tree mortality after 2004, with no new dead trees 2004-2016 on Piney Hill plots (but some trees died at the site, Figure 6.1), one impact of the ongoing 2000s drought could be an increase in tree mortality among higher-elevation forests that are less adapted to drought conditions than their lower-elevation counterparts.
As seen across the Chuska Mountains and at FFe, the ongoing drought could be taking a toll by increasing mortality among the most vulnerable individual trees. Some other areas of the region experienced major increases in tree mortality during the early 2000s, summing to forest die-off, especially in water-limited piñon-juniper forests87. Unlike these areas, however, tree die-off was not detected at CFI plots or demography sites on the Navajo Nation in our study. The increases in tree mortality we calculated after 1991 are substantial but are fairly isolated to discrete patches scattered around the Navajo forest area.
Every year since 1997 the US Forest Service flies over the region and surveys forest health issues. Their flights include the Navajo forest area, and data are available online. According to USFS Forest Health Protection surveys through 2017, the worst years of forest mortality within the Navajo commercial forest area were 2002-2003 with nearly 140,000 acres affected (Figure 6.5). Mortality patches from the 2002-2003 event were widely distributed, though some of the largest patches were in lower-elevation areas. Indeed, the mortality wave, especially among piñon and juniper spread further down slope into areas at lower elevation than the commercial forest area. The largest sources of mortality in 2002-2003, as identified by the Forest Service, were drought (37%), pinyon ips beetles (31%), and ips engraver beetles (23%). In examining the survey data across other years, roughly 3,400 acres experienced mortality on average, with a maximum of 12,000 acres (in 2005).
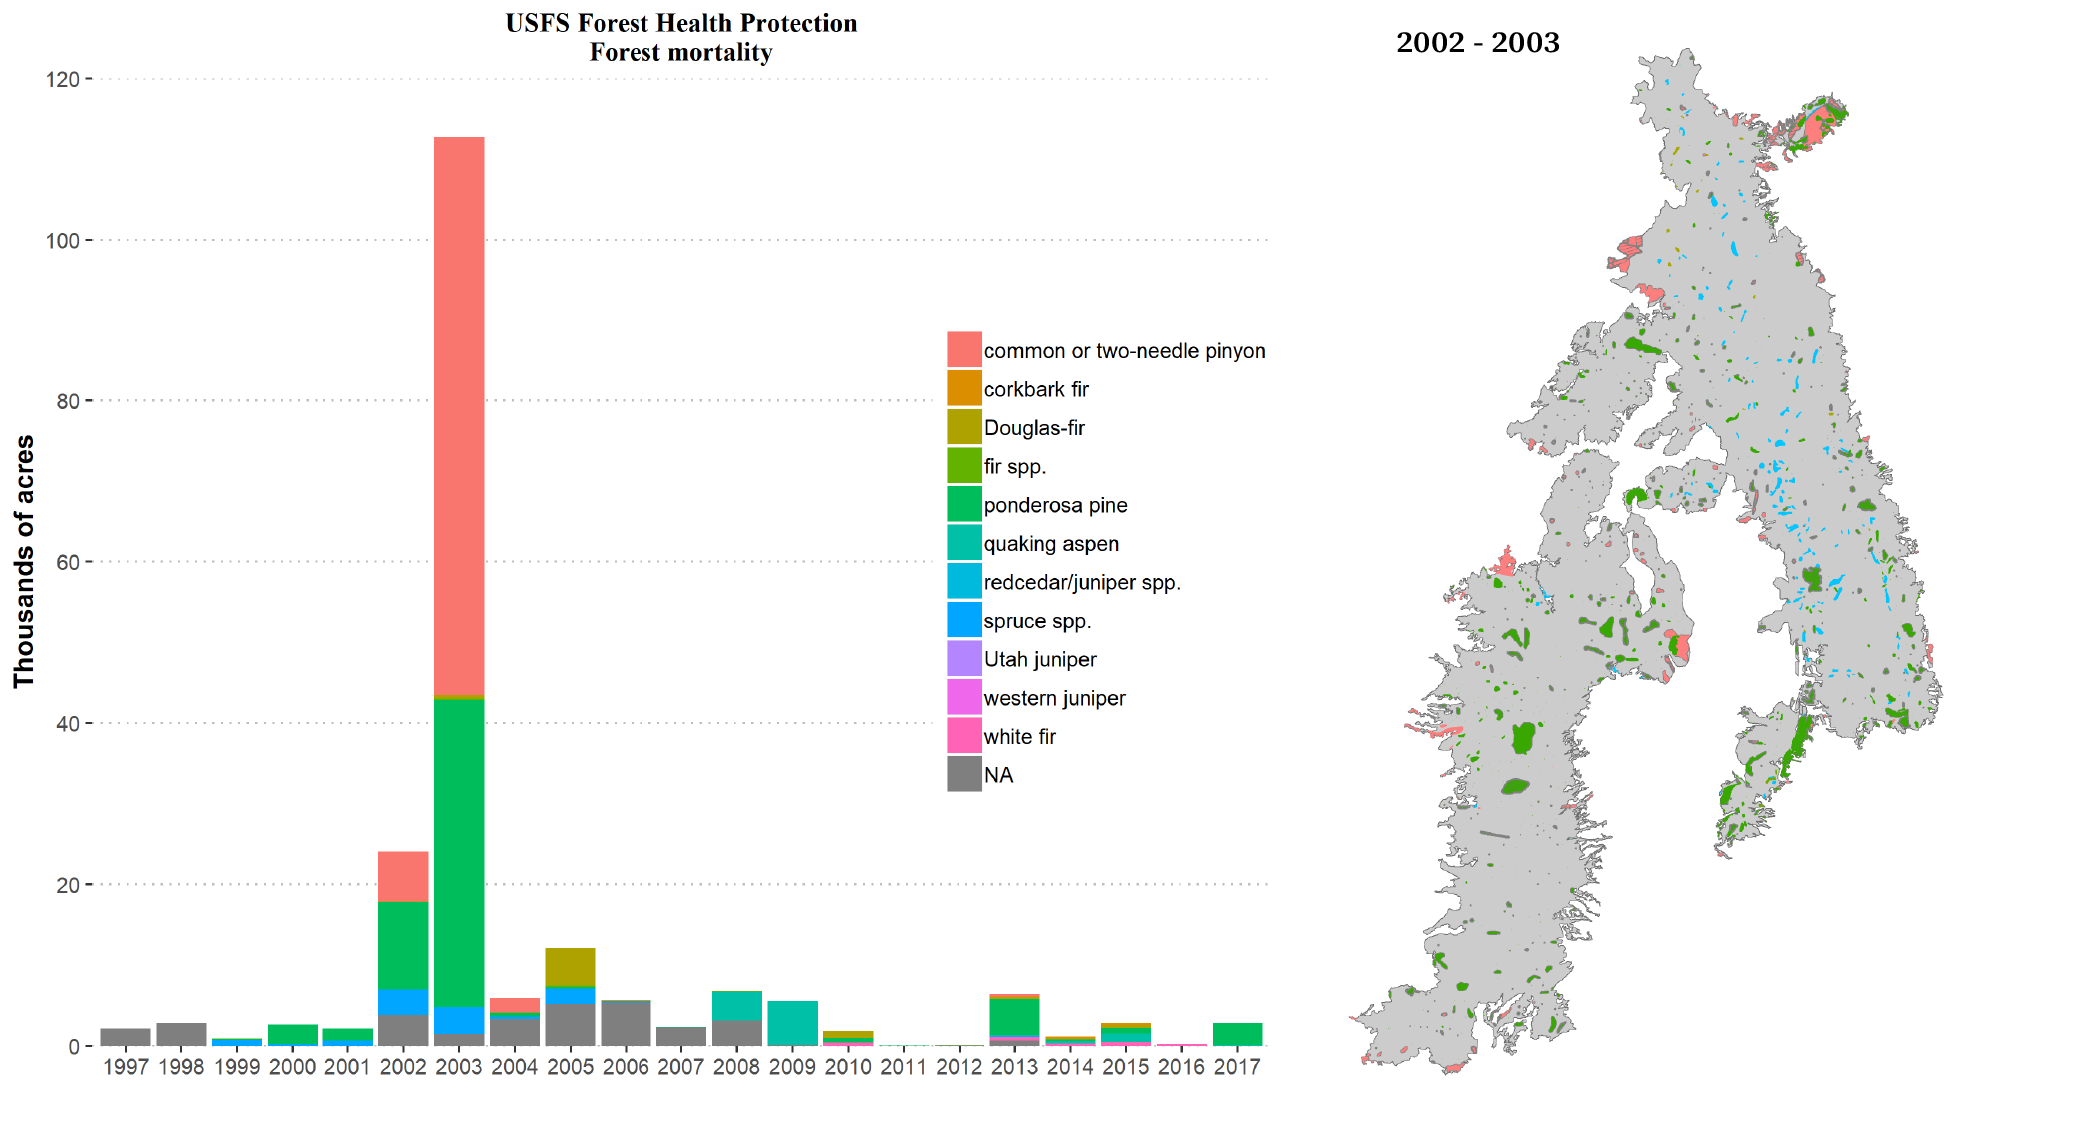
Figure 6.5: Acreage of forest mortality based on aerial surveys by the US Forest Service. At left is the timeseries of mortality within the Navajo commercial forest by species (NA are unidentified species). The spatial distribution of mortality patches for the commercial forest is on the right.
The USFS Forest Health Protection also provides predictions of forest mortality over the next decade. The greatest losses in stand basal area (forest density) are predicted along the fringes of the commercial forest area (Figure 6.6). These are the areas where the highest mortality was been observed over the last two decades. Losses in some areas could be over 55 square-feet per acre, or more than 35% of the pre-2013 density. Within the commercial forest area, predicted losses are among the lowest, averaging 5-20% of basal area. These numbers may be in line with rates of tree mortality we found on CFI plots since the last inventory in 2004.
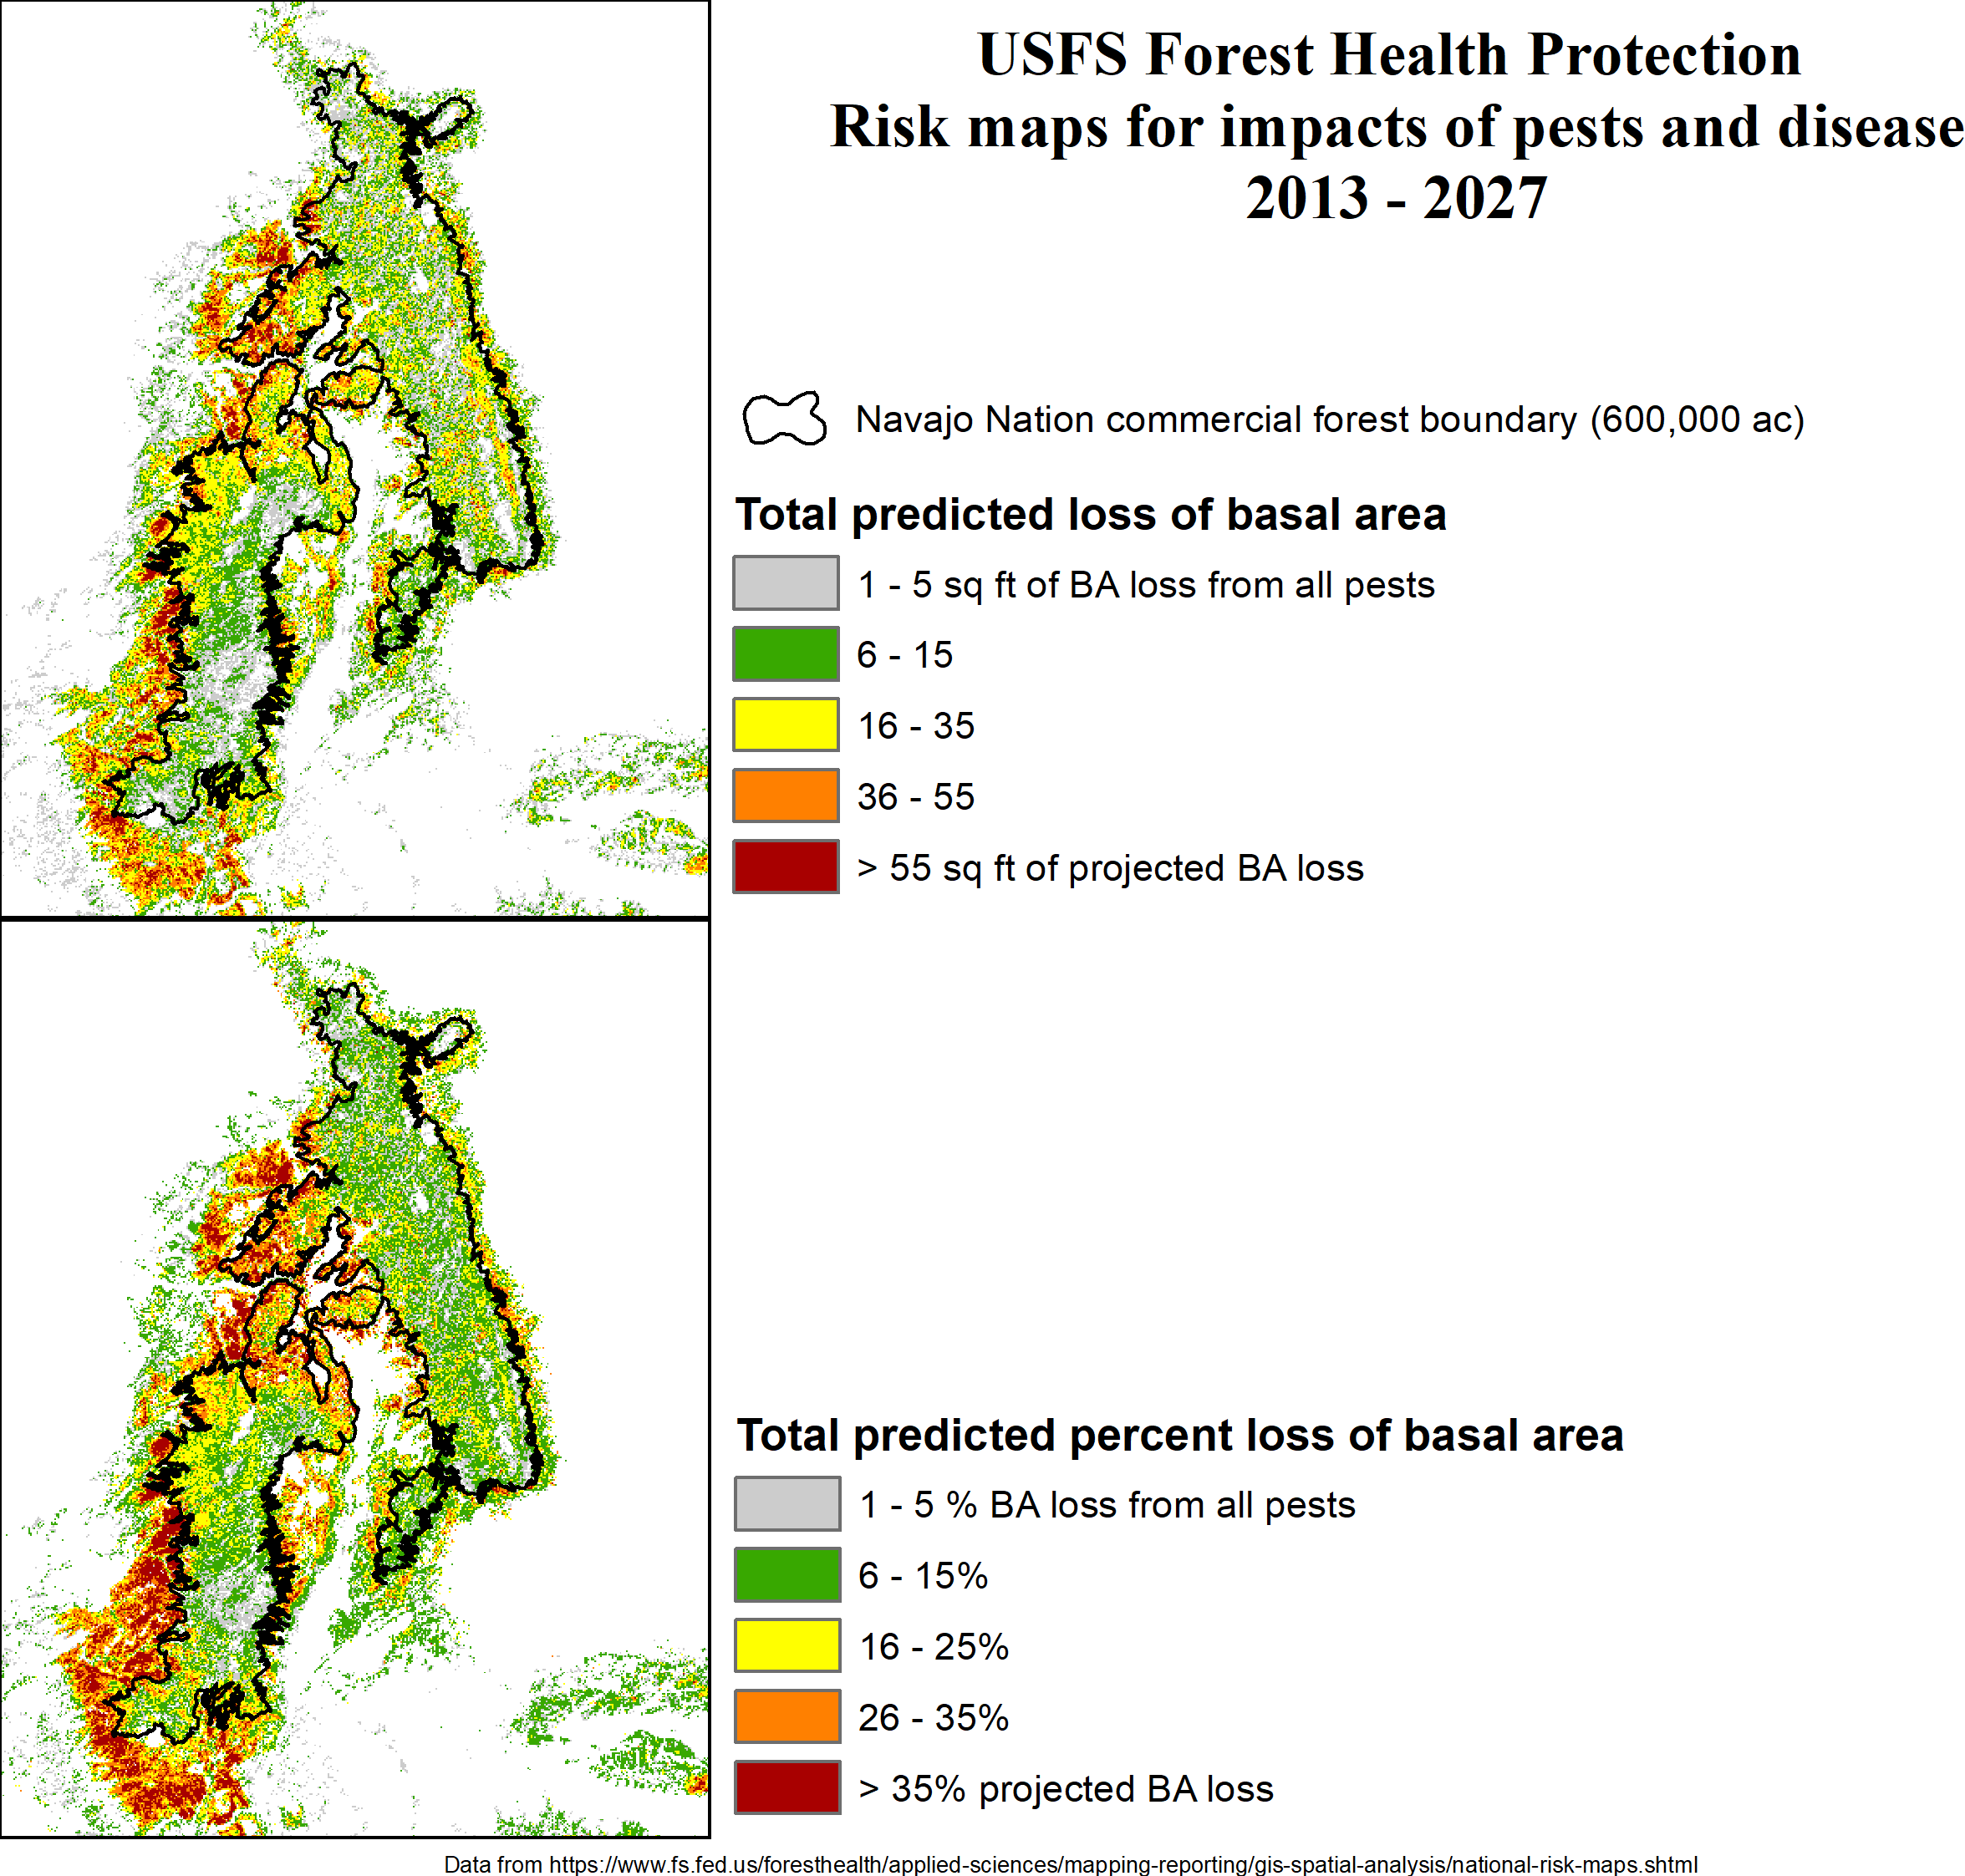
Figure 6.6: Predicted losses of stand basal area for the period 2013-2017.
6.4 Conclusions
Climate change is making conditions for conifer trees in the Southwest more stressful. Warmer temperatures turn average years into drought years and aggravate drought conditions. This raises the potential for widespread tree mortality from a variety of causes, including heat stress, water limitations, insects, disease, and fire. Monitoring the rates and areas of tree mortality is a key component to understanding and managing for forest health. Here, we have synthesized over three decades of forest plot measurements and added new tree-ring reconstructions of tree mortality at three representative old forest sites. Overall rates of conifer tree mortality were quite low (0.2-0.3% per year) and not out of bounds for general expectations of background mortality levels in semi-arid pine-dominated forest ecosystems.
Rather than portend broadscale changes for the Navajo forest resource, the old-growth demography sites probably better represent some of the most robust drought-tolerant sites in the forest. Many of the trees are over 300 years old, having survived multiple prolonged droughts in their lifetimes. These low- to mid-elevation sites, such as Tohatchi Lookout (TLK) and PNH, as well as CFI plots on the Defiance Plateau are among the longest-lived forest stands of the Navajo forest. Upper-elevation sites, similar to FFe, have greater productivity and thus greater turn-over, where maximum lifespans are shorter and new trees often readily replace older, dying trees. Thus we should expect somewhat higher rates of background tree mortality at upper-elevations. But conversely, the lower-elevation edge of tree distributions most often succumb to drought-induced tree die-off88,89, and that is what we have not yet seen in Navajo forests. Large areas of the Chuska Crest were also some of the most heavily logged sites in Navajo forests, creating younger stands with high levels of competition. Competition often leads to mortality of less-competitive individuals, and the winners grow stronger, larger, and more dominant. These stand dynamics are at work across most of the Chuska Mountains area, and could account for much of the annual mortality found there. Another effect of past logging was to remove the largest and oldest individuals; trees that otherwise may be succumbing to mortality now had they remained in the forest. Those past removals may have offset mortality rates and lowered the overall average for decades.
Increased mortality since 2004 at the upper-elevations, however, may be the signal that conditions are changing. Ongoing drought and warmer temperatures may be starting to stress trees beyond their capacity for resistance to drought in areas that have not really experienced much drought over at least the last century or longer (see Tree growth response to climate). Although mortality rates at the upper-elevation sites are beginning to rise to levels seen a decade ago across western US forests22, we recommend further monitoring of drought conditions and tree mortality to aid in understanding how climate change is impacting and will further impact this significant forest resource.
Given some grim projections of forest drought stress15 and the potential for even greater tree mortality in the region82 with climate change, it is reassuring to find that such dramatic changes have not yet affected much of the Navajo forest. Although, threats loom and increased mortality is likely. Temperatures are on the rise, exacerbating drought conditions and potentially affecting tree resilience to insect attack and fire. Regional patterns of tree mortality, insects, and fire behavior should still give us pause, and put us on alert for such changes in Navajo forests.
References
9. Breshears, D. D. et al. The critical amplifying role of increasing atmospheric moisture demand on tree mortality and associated regional die-off. Frontiers in plant science 4, 266 (2013).
22. van Mantgem, P. J. et al. Widespread increase of tree mortality rates in the western United States. Science (New York, N.Y.) 323, 521–524 (2009).
21. Allen, C. D. et al. A global overview of drought and heat-induced tree mortality reveals emerging climate change risks for forests. Forest Ecology and Management 259, 660–684 (2010).
15. Williams, A. P. et al. Temperature as a potent driver of regional forest drought stress and tree mortality. Nature Climate Change 3, 292–297 (2013).
82. McDowell, N. G. et al. Multi-scale predictions of massive conifer mortality due to chronic temperature rise. Nature Climate Change 6, 295–300 (2016).
20. Allen, C. D., Breshears, D. D. & McDowell, N. G. On underestimation of global vulnerability to tree mortality and forest die-off from hotter drought in the Anthropocene. Ecosphere 6, art129 (2015).
83. Bennett, A. C., McDowell, N. G., Allen, C. D. & Anderson-Teixeira, K. J. Larger trees suffer most during drought in forests worldwide. Nature Plants 1, 15139 (2015).
84. McDowell, N. G. & Allen, C. D. Darcy’s law predicts widespread forest mortality under climate warming. Nature Climate Change 2–5 (2015). doi:10.1038/nclimate2641
85. Lindenmayer, D. B., Laurance, W. F. & Franklin, J. F. Global decline in large old trees. Science 338, 1305–1306 (2012).
44. Guiterman, C. H. Climate and human drivers of forest vulnerability in the US Southwest: Perspectives from dendroecology. 185 (University of Arizona, 2016).
86. Lewis, S. L. et al. Tropical forest tree mortality, recruitment and turnover rates: calculation, interpretation and comparison when census intervals vary. Journal of Ecology 92, 929–944 (2004).
87. Breshears, D. D. et al. Tree die-off in response to global change-type drought: mortality insights from a decade of plant water potential measurements. Frontiers in Ecology and the Environment 7, 185–189 (2009).
88. Allen, C. D. & Breshears, D. D. Drought-induced shift of a forest-woodland ecotone: rapid landscape response to climate variation. Proceedings of the National Academy of Sciences 95, 14839–42 (1998).
89. Kelly, A. E. & Goulden, M. L. Rapid shifts in plant distribution with recent climate change. Proceedings of the National Academy of Sciences of the United States of America 105, 11823–6 (2008).