Section 5 Tree growth response to climate
Ongoing drought conditions in the Southwest raise concerns about declining tree growth and forest productivity. Growth declines attributed to warm, dry conditions have already been documented across the Southwest and parts of the western US, and are predicted to worsen over the next 20-30 years with climate change15,27,31,75,76. Declining tree growth is of concern because it would lead to substantial losses of forest productivity, carbon sequestration, and ecosystem services20,77,78.
In the Southwest, tree growth is primarily limited by soil moisture79. Temperature influences the availability of soil moisture by drawing water from soil and plants and into the atmosphere. The atmospheric demand for water rises exponentially as temperature increases9,15. This exasperates drought, even turning normal conditions into a drought. From a tree perspective, a warming climate means that average years in the future will be like the worst drought years of the past15.
How future drought conditions manifest across the region depends largely on the characteristics of individual landscapes. Variations in topography, soil type, soil depth, and elevation impart differential responses of trees to climate80. Trees with low climate sensitivity (those that grow well during dry years) tend to resist disturbances more effectively than climatically stressed individuals30,81. Therefore, understanding where on the landscape trees are more versus less sensitive to climate is key to understanding landscape-scale vulnerability to climate change.
Here, we examine patterns of tree growth across the Navajo forest. We quantify climate sensitivity and map its spatial distribution, and then evaluate the role of climate in changing patterns of tree growth. Finally, we assess whether growth declines have occurred in Navajo forests due to the current, ongoing drought.
5.1 Where are Navajo trees most sensitive to drought conditions?
To quantify the patterns of tree growth response to drought across the Navajo forest, we needed to sample the Chuska Mountains-Defiance Plateau landscapes in a representative fashion. Partnering with the Navajo Forestry Department was vital in this task (Figure 5.1). We were able to subsample the extensive network of Continuous Forest Inventory (CFI) plots that includes 272 plots across the 600,000 acre commercial forest area. Our subsample captures a gradient in soil moisture defined by elevation (high/wet, low/dry) and topography, wherein lower-slope and valley positions have both greater moisture availability and deeper soils than do ridge-tops or steep slopes. Likewise, southerly and westerly aspects are drier than easterly and northerly aspects due to enhanced solar radiation. Our selection of CFI plots across this topo-climate gradient led us to 36 CFI plots that included piñon, ponderosa pine, and/or Douglas-fir (Figure 5.2). We cored 5-15 trees of each target species, resulting in more than 500 trees cored during the 2014 and 2015 field seasons. In all, our analysis includes over 129,000 dated and measured rings from 899 cores and 469 CFI trees. We paired this dataset with tree-ring collections from 11 sites that were targeted as good dendroclimate sites, i.e. those in which trees would reflect climate variability very closely. The tree-ring growth patterns from these targeted climate sites were averaged together as a metric of the broad-scale climate that trees respond to on the Navajo Nation, and thus we call it the Navajo Forest Drought Stress Index, or NavFDSI after the regional FDSI compilation by 15.
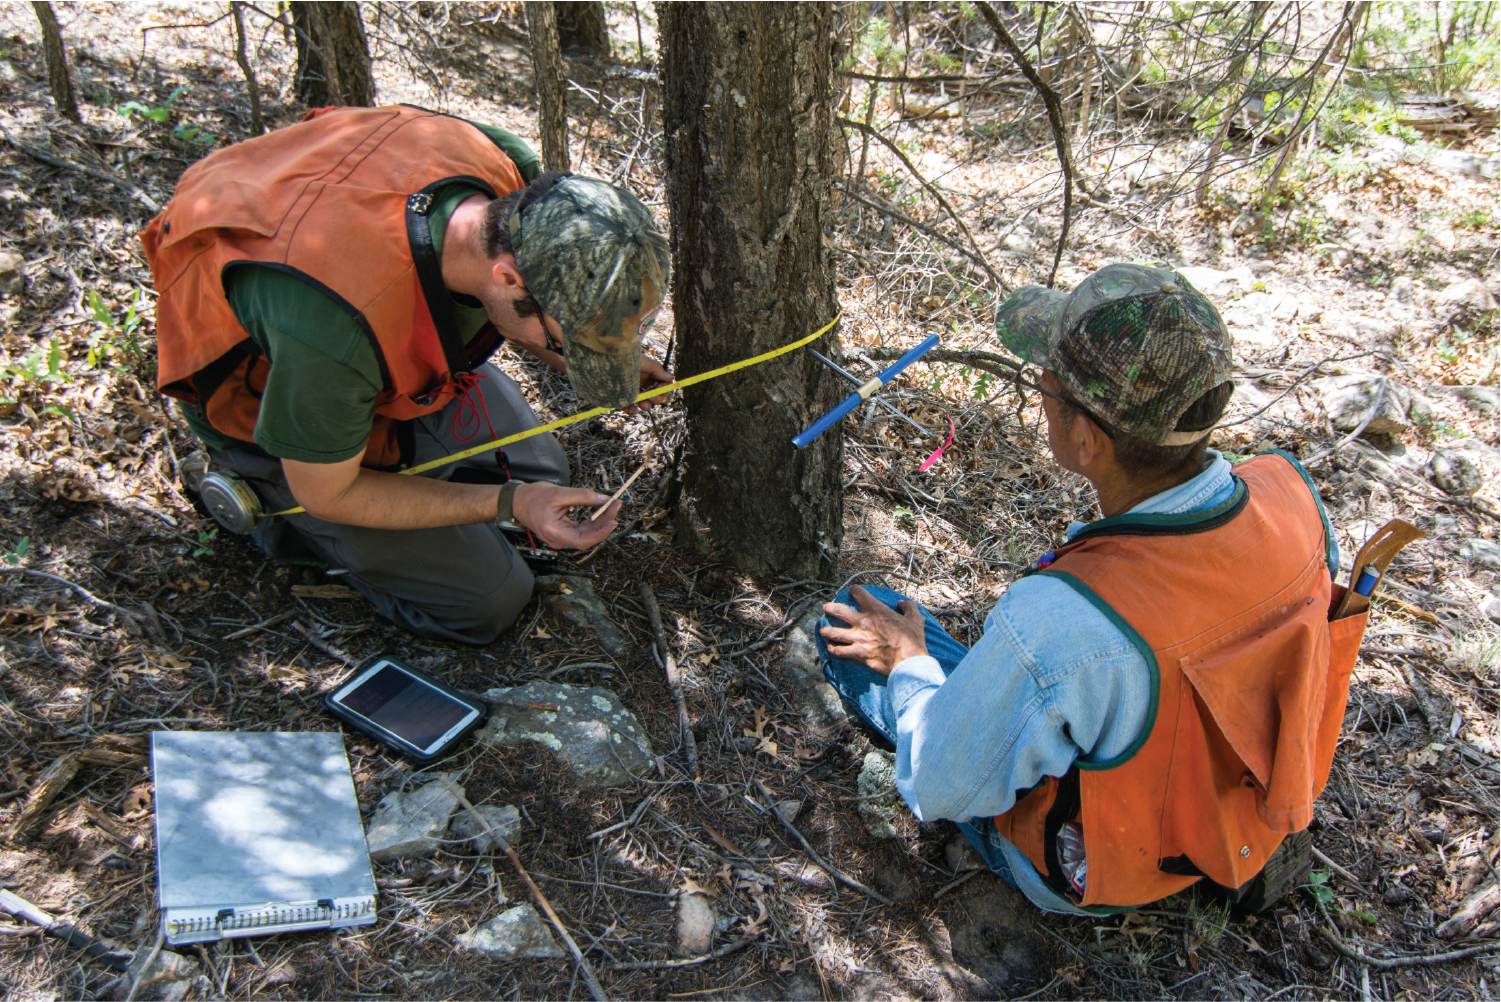
Figure 5.1: Collecting increment cores and tree data on a CFI plot in 2014. At left is researcher Chris Guiterman and at right is Navajo Forestry technician Tim Jim. Photo credit: D. Ferguson.
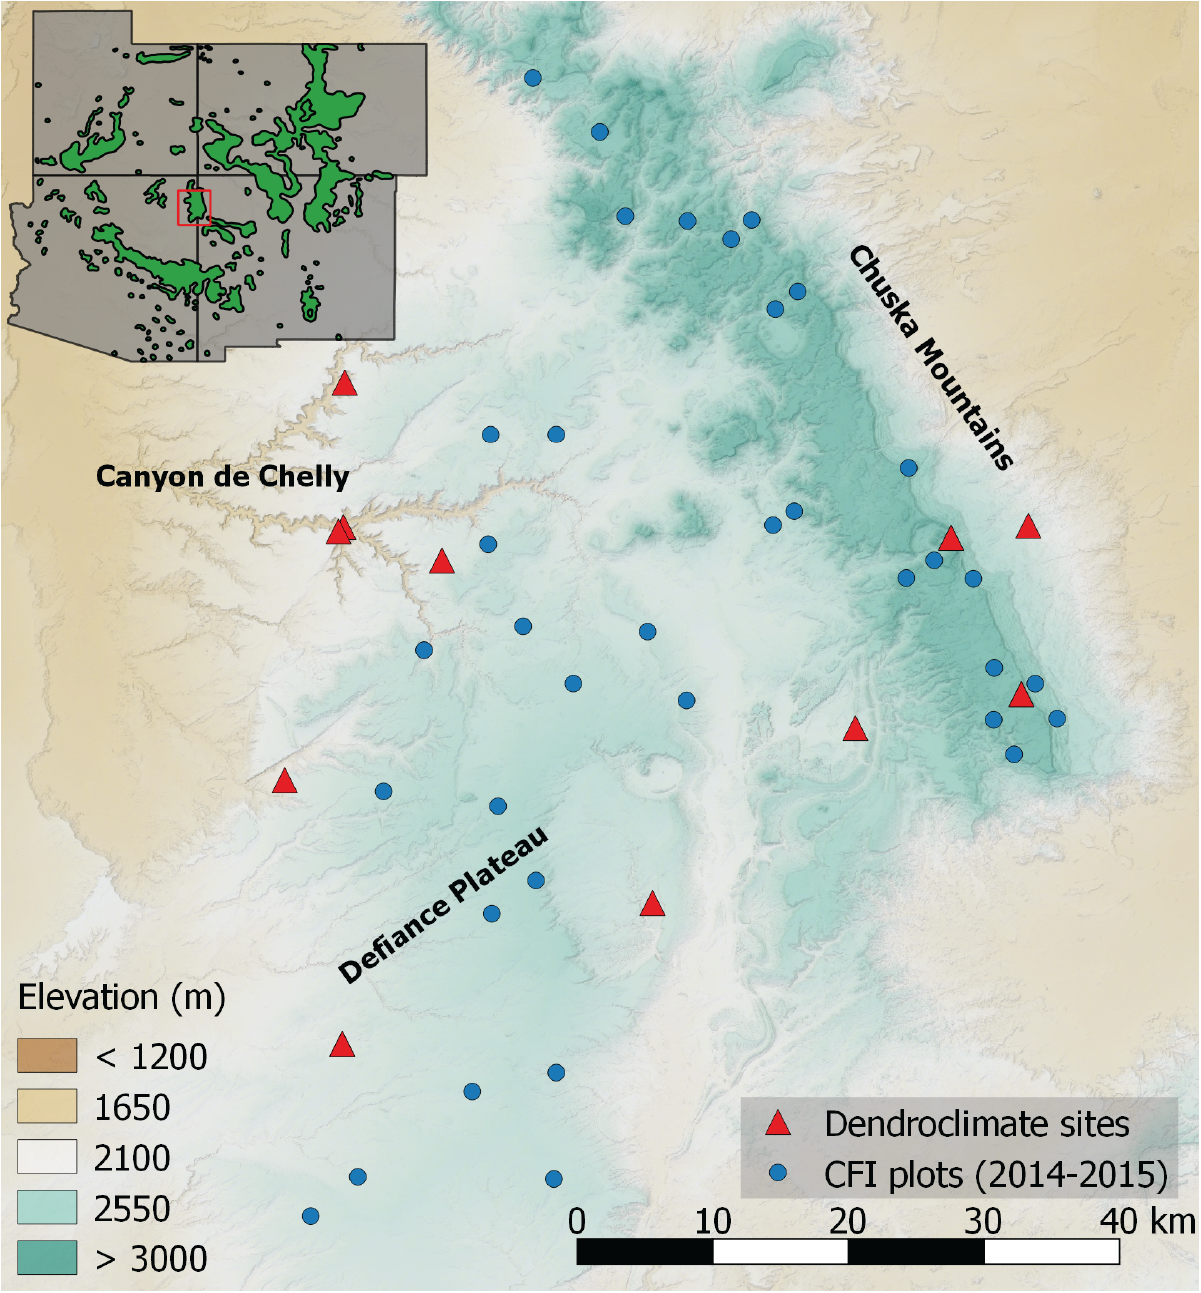
Figure 5.2: Spatial distribution of tree-ring sample sites and CFI plots on the Navajo forest. Inset map shows the location of the study area in the Four Corners, with green areas representing the range of ponderosa pine.
Correlations of tree growth at the CFI plots with NavFDSI show the landscape distribution of climate sensitivity across the Chuska Mountains-Defiance Plateau study area (Figure 5.3). The areas of highest correlations are those that respond most closely to drought events, and are thus the most climate sensitive. On the opposite end of the spectrum, plots with low correlations include trees whose growth is not highly driven by climate - they are not climate sensitive. In essence, these trees are buffered from drought by some landscape factor.
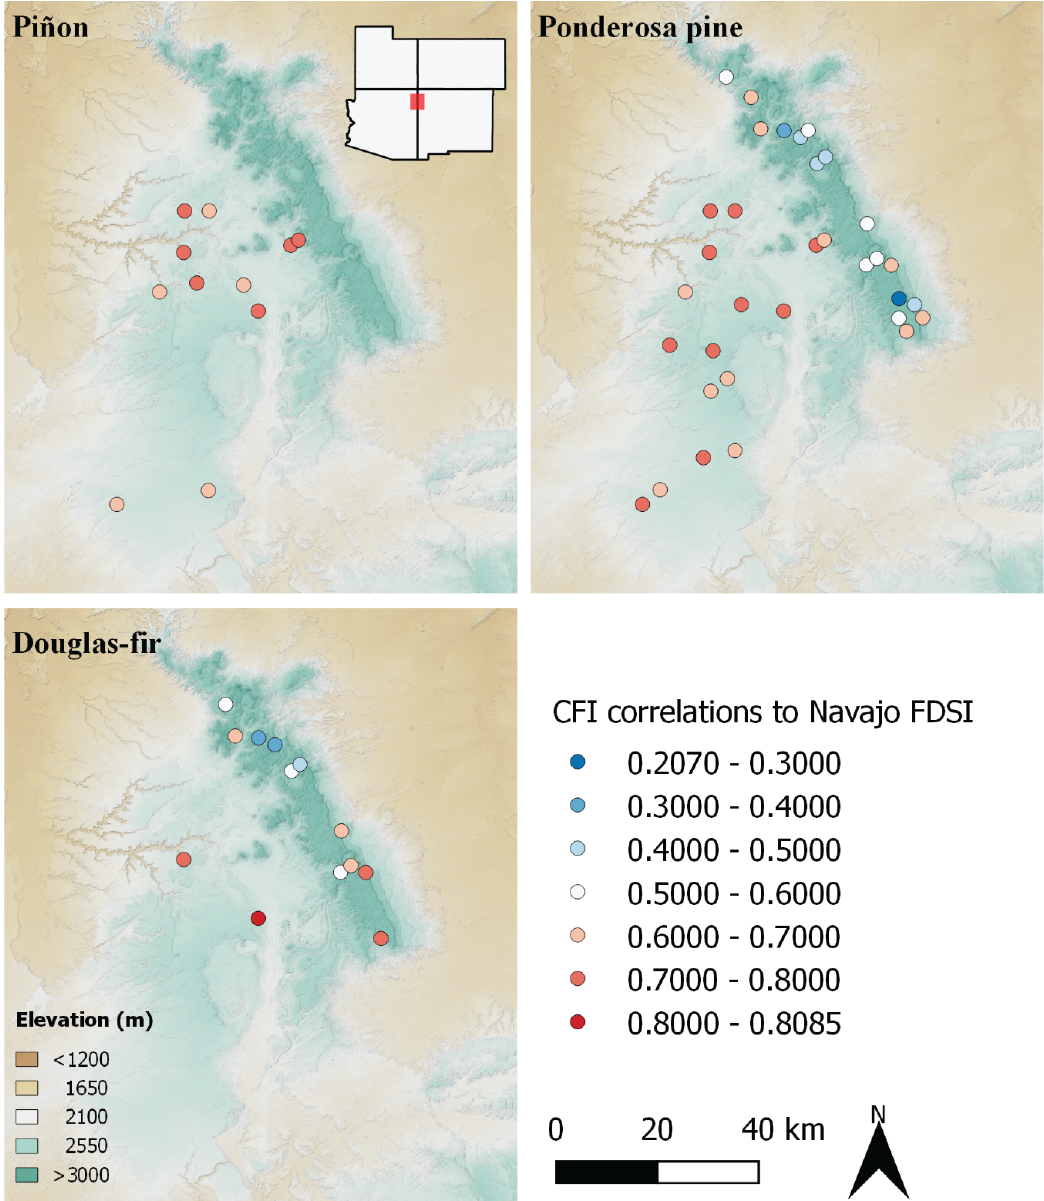
Figure 5.3: Correlations between CFI plot chronologies and NavFDSI. Higher correlations indicate greater tree-growth sensitivity to climate.
Each of the three tree species we analyzed include high correlations and high climate sensitivity, reflecting the general trend that tree growth across the Southwest is largely limited by moisture availability and landscape position and elevation play important roles in determining climate sensitivity. Plots with low sensitivity tend to occur in certain areas, and in other areas all species show a high degree of sensitivity. The pattern for piñon, however, is remarkable because all plots show nearly the same pattern of high climate sensitivity. This is surprising because on CFI plots piñon is at the upper-elevation edge of its regional distribution, mainly growing within the ponderosa pine zone. Typically, trees at their cooler/wetter edge are less sensitive to moisture availability, and growth is more related to competition or other factors80. But that’s not what we have found here with regard to piñon on CFI plots, where it is climatically sensitive.
Ponderosa pine is the most widely distributed tree species on the Navajo landscape and shows a wide range of sensitivity to climate. Generally, trees on the Defiance Plateau are the most highly responsive to climate variation, while areas of the Chuska Crest are less sensitive. This does not imply that where ponderosa pines are co-dominant with other species like Douglas-fir, it is less climate sensitive, because some lower-elevation plots include both or all three species and show among the highest correlation to NavFDSI we found. Therefore, for ponderosa pine as for piñon, landscape factors are most important in determining climate sensitivity.
Douglas-fir is present at the lowest- and highest-elevation CFI plots, either on the Chuska Crest (especially in the Lukachukai area) or in canyons or north-facing slopes low on the Defiance Plateau. This distribution reflects regional patterns31 and is likely the result of Douglas-fir establishment being limited by historically frequent surface fires. In mid-elevation locations, fires were too frequent for Douglas-fir to survive, but fires were rare in low-elevation canyons and slopes that lacked abundant surface fuels. At higher-elevations, fire frequency was lower, allowing the fire-susceptible Douglas-fir seedlings to grow tall and large enough to resist fire. The climate sensitivity of Douglas-fir is equally bi-modal, with the highest and lowest correlations of any species. The low-elevation sites are among the most arid locations for CFI plots, and Douglas-fir growing here were remarkable recorders of climate variation. On the Chuska Crest, by contrast, Douglas-fir growth is rapid and is generally not reflective of regional climate patterns. Those trees have not really experienced drought, and because of that, their climate sensitivity is low. It is these sites where buffers to drought are the greatest.
5.2 What explains the landscape variability in climate sensitivity?
Among the many topographic and climate variables that might help to explain the landscape variation in climate sensitivity, we found that elevation did the best job (Figure 5.4). Elevation captures changes in precipitation (higher is wetter), temperature (higher is cooler), and VPD (higher is lower), and is positively correlated with multiple metrics of forest structure like density and basal area across the CFI plots. Changes in elevation explain nearly half of the variation in climate sensitivity for ponderosa pine, our best-sampled species. If we could add plots for Douglas-fir and piñon, we might find similar patterns. But in general, as elevation increases, sensitivity to climate decreases for both ponderosa pine and Douglas-fir. For piñon, there’s no elevation trend, but as we noted, our sample of piñon is only the upper-elevation slice of its overall distribution. It is possible that lower-elevation piñon may be more sensitive to climate, resulting in similar trends as for the other species.
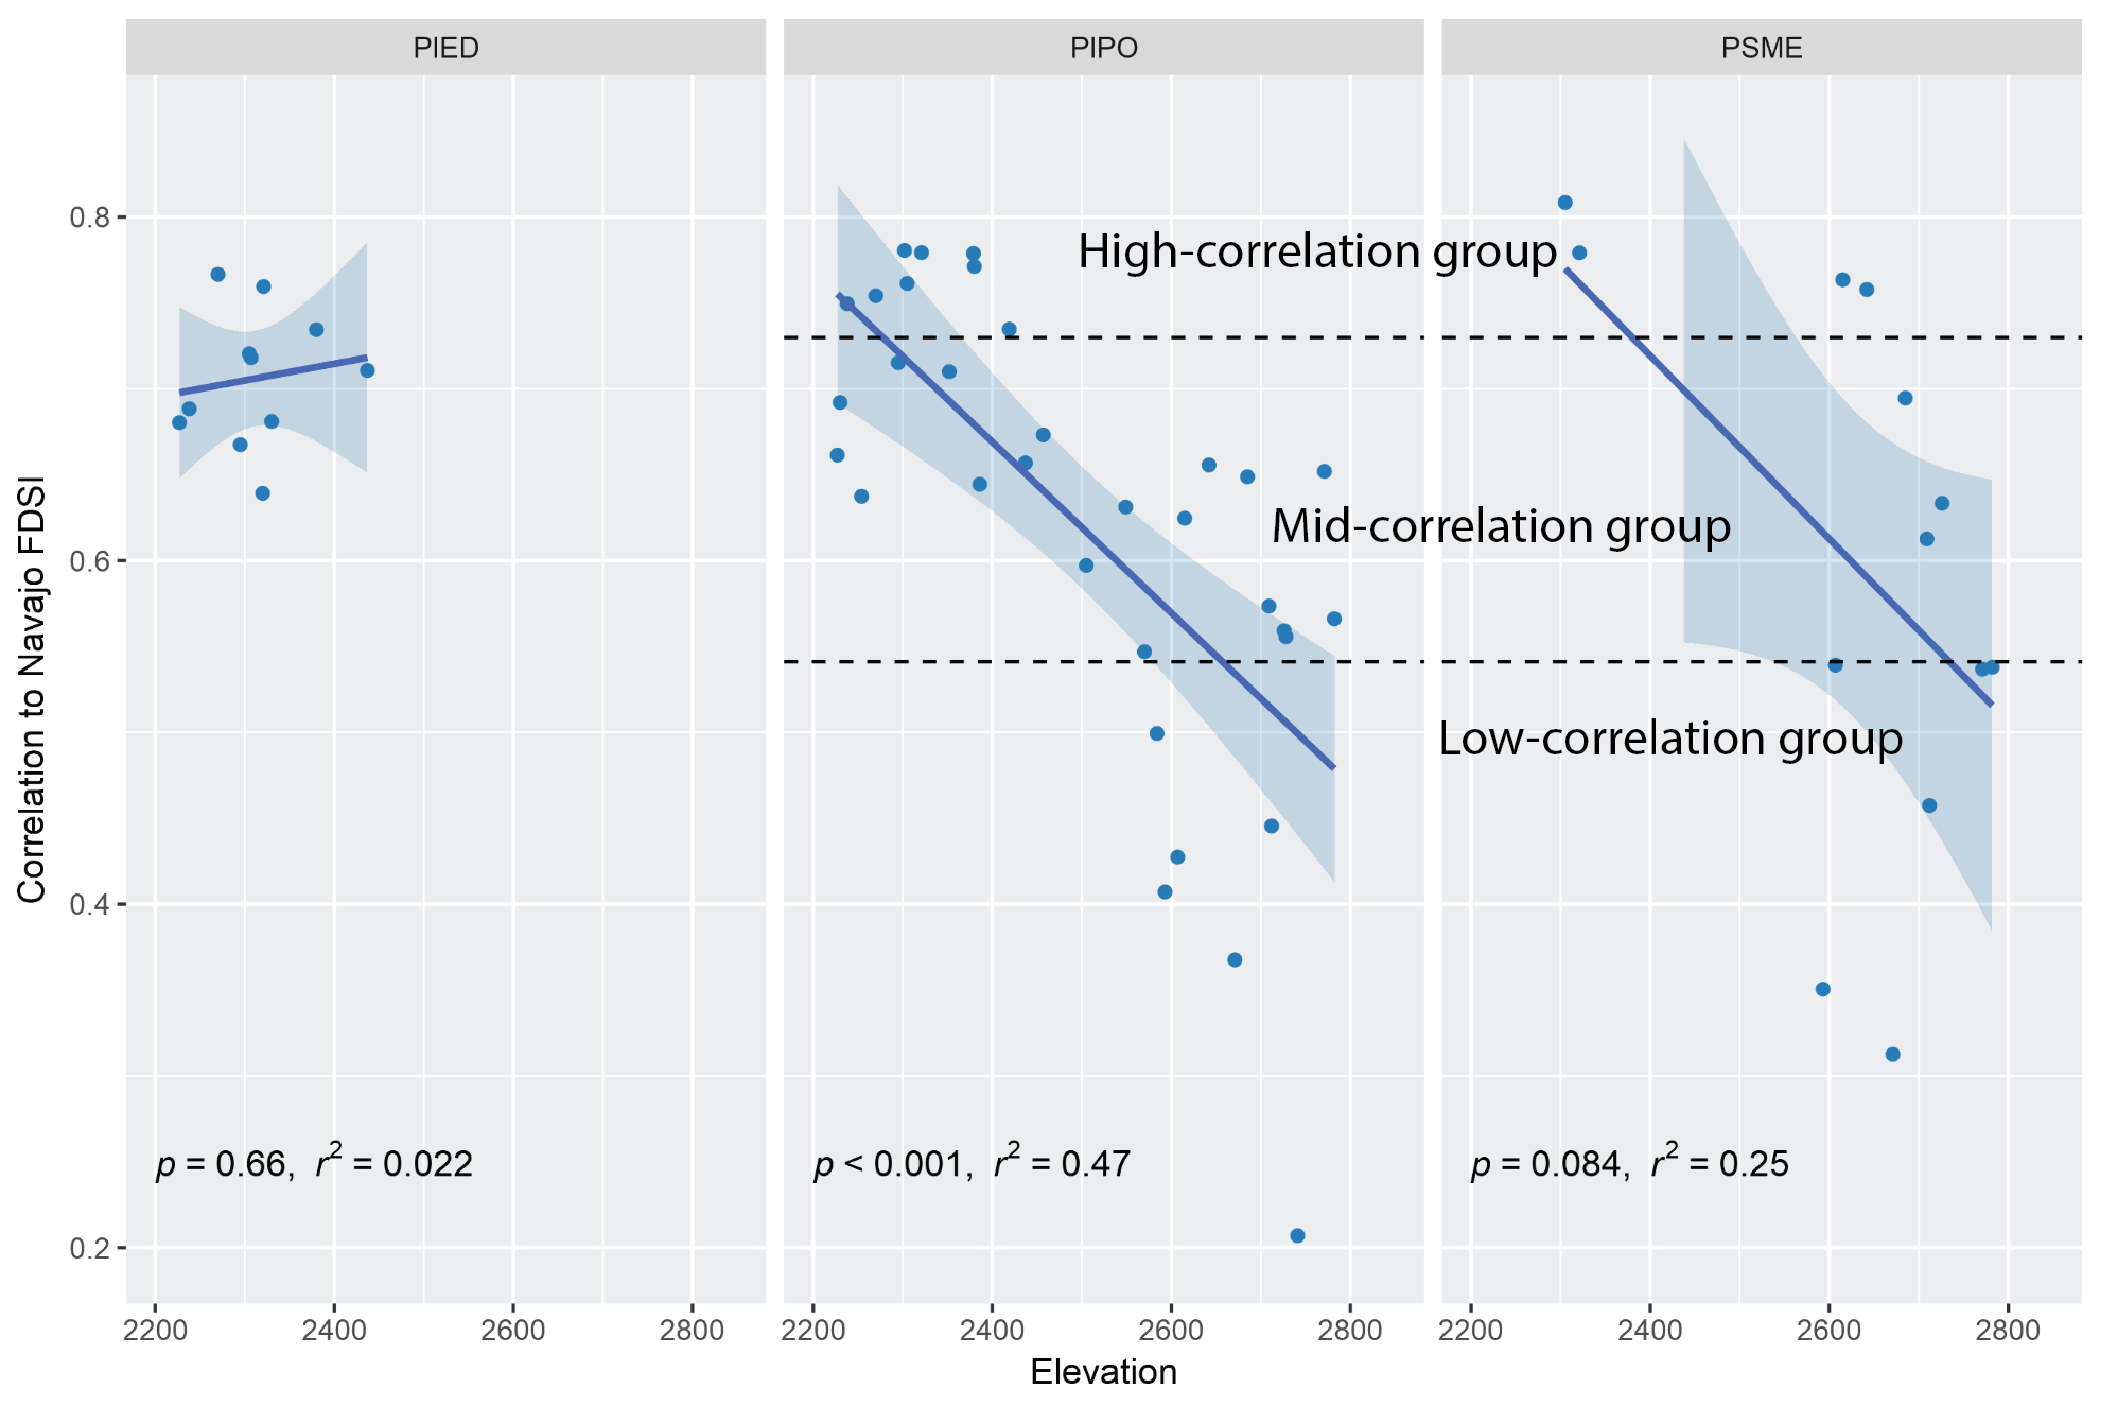
Figure 5.4: Climate sensitivity as a function of elevation for CFI plots. Each panel presents a difference species: PIED piñon; PIPO ponderosa pine; PSME Douglas-fir. The PIPO and PSME were divided into three categories based on the strength of correlation.
To better understand differences among CFI plots with regard to drought impacts on tree growth, we grouped the plots based on their sensitivity to climate. We created four groups, as seen in Figure 5.4: piñon (PIED), high-correlation ponderosa pine and Douglas-fir (HighCor), mid-correlation ponderosa pine and Douglas-fir (MidCor), and low-correlation ponderosa pine and Douglas-fir (LowCor). Although these groups are based on climate sensitivity, they also reflect general patterns in the elevational distribution of plots. Higher-elevation, lower-correlation and lower-sensitivity plots are in the LowCor group, while lower elevation, more climate-sensitive plots are in the HighCor group. The MidCor group spans the elevation range, and is likely influenced by other topographic factors such as solar radiation and soil quality/depth.
The growth patterns within and among these groups are quite similar, and it is clear from the tree growth patterns presented in Figure 5.5 that the PIED and HighCor groups have the greatest variability in tree growth, reflecting their high climate sensitivity. One pattern sticks out here that deserves further attention: since roughly 1985, the growth variability of the LowCor, higher-elevation trees has changed markedly. It has greater variability across all plots and appears to also have greater synchrony between plots. These changes could indicate change climate sensitivity that would have to be related to recent change sin the climate.
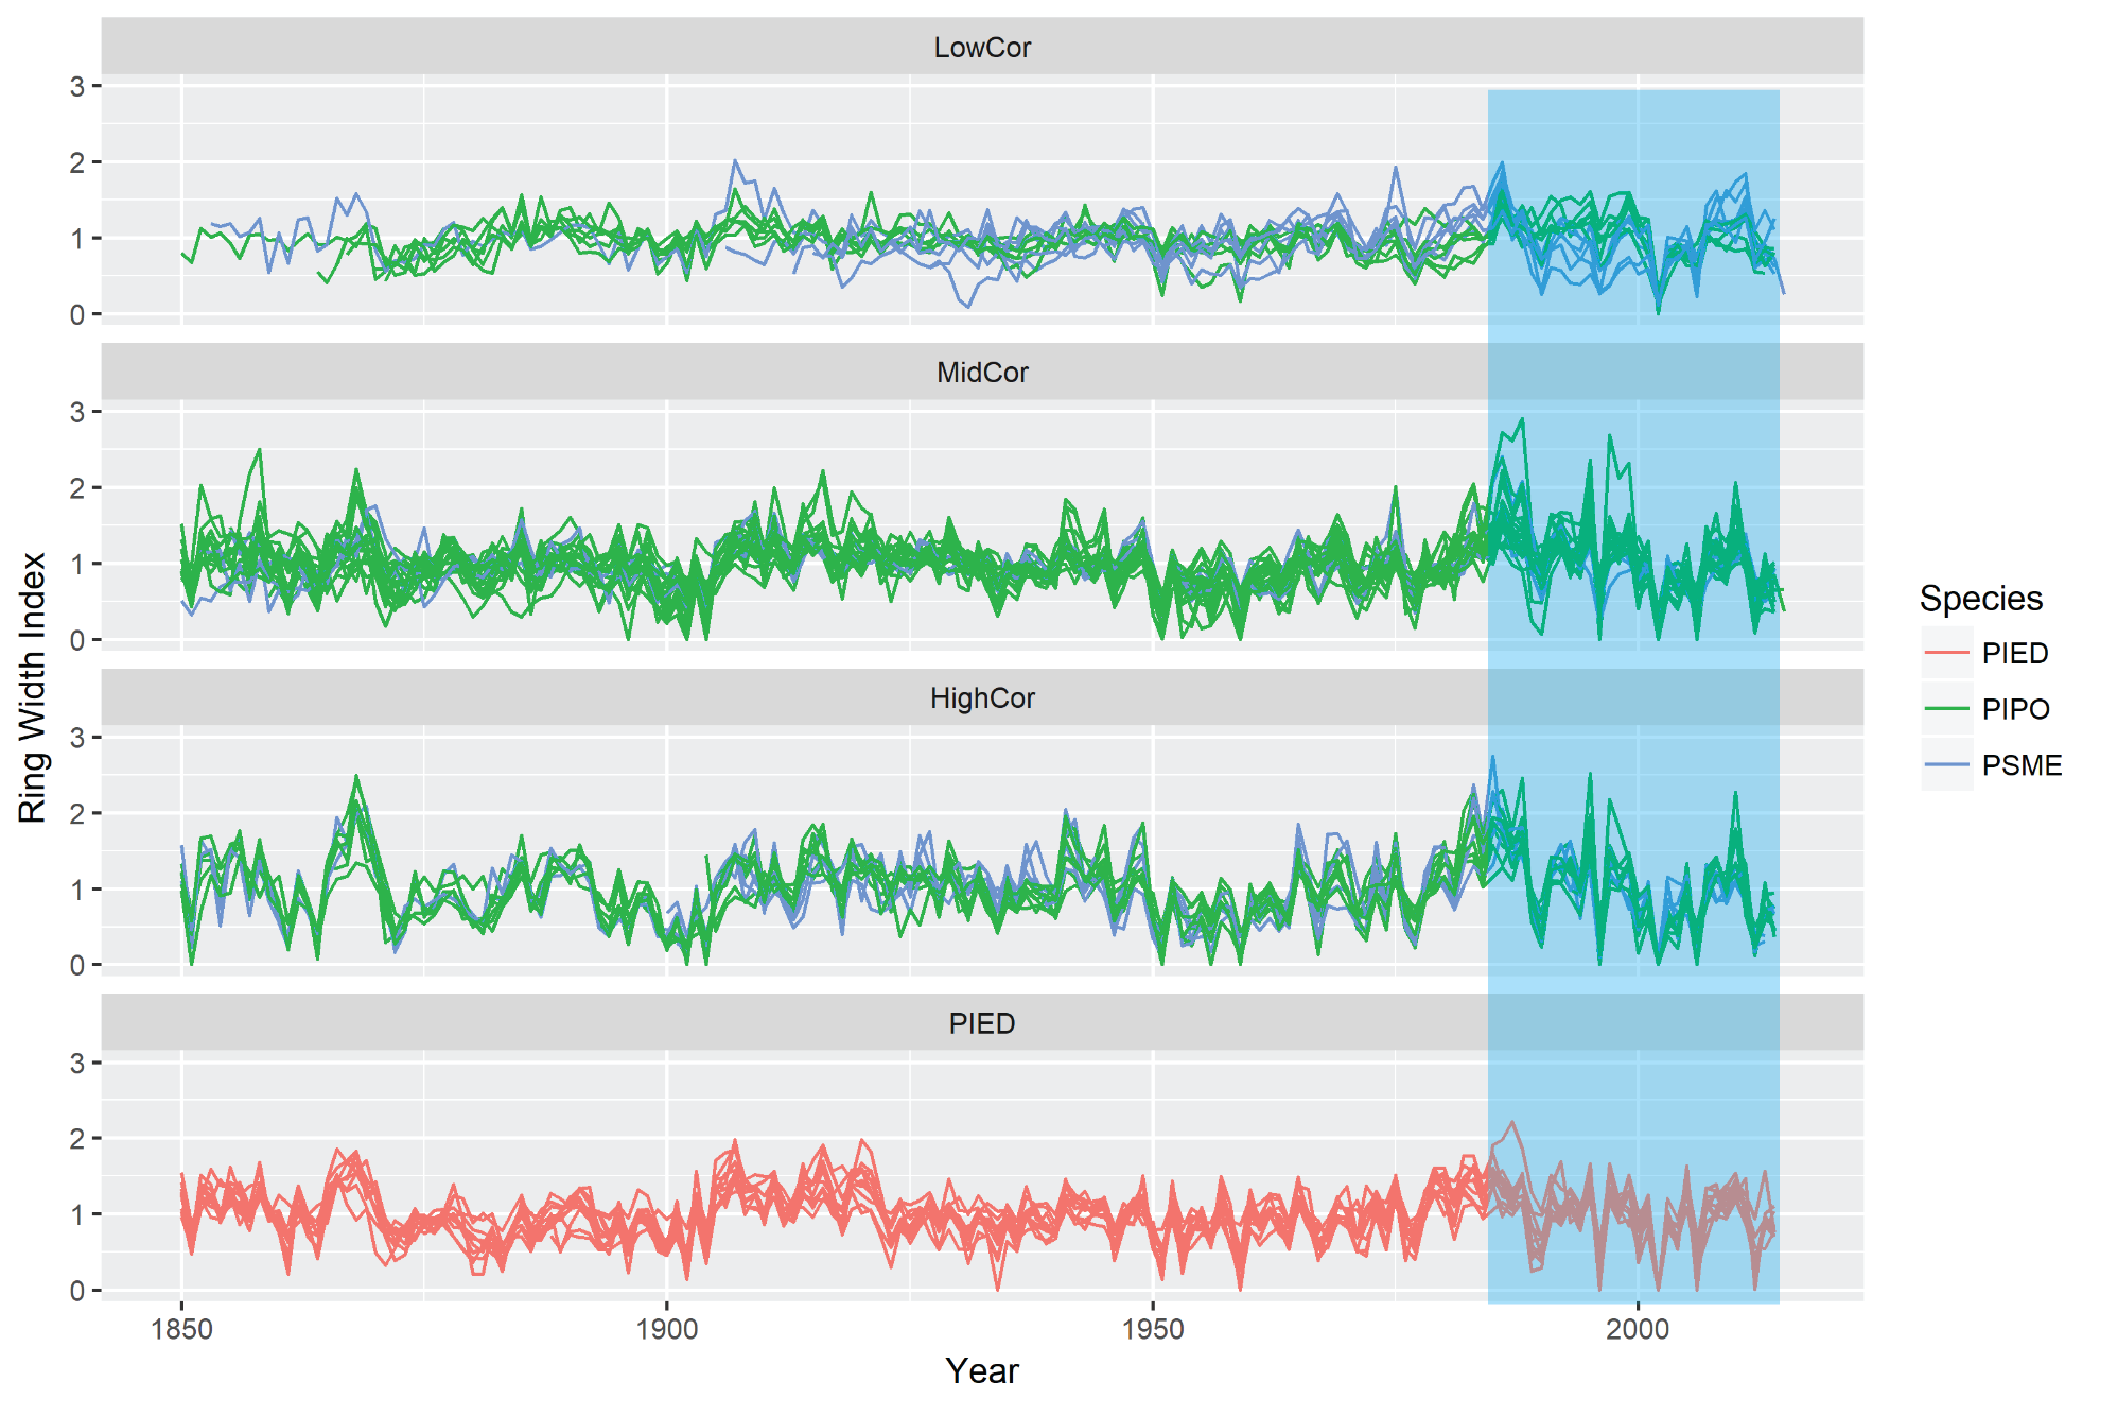
Figure 5.5: Growth patterns of CFI plots, divided by species and strength of correlation. The blue shaded area represents the period since ~1985 in which growth character has changed with climate change.
We tested the degree to which our observation of changing growth pattern at the upper-elevation LowCor plots is real and biologically meaningful. This was done in two ways: First, we assessed a metric called Express Population Signal, or EPS, that quantifies how well the growth patterns between different plots are synchronized (Figure 5.6). Greater synchrony in growth indicates higher overall response to climate, as it is climate that regulates synchrony in tree growth. And indeed, the last 30-year growth period (1986-2016) has an EPS value in the LowCor group that is higher than anything since 1900, and is within the long-term range of the other groups. We found upward trends in EPS to be significant for both the LowCor and MidCor groups, based on regression analysis.
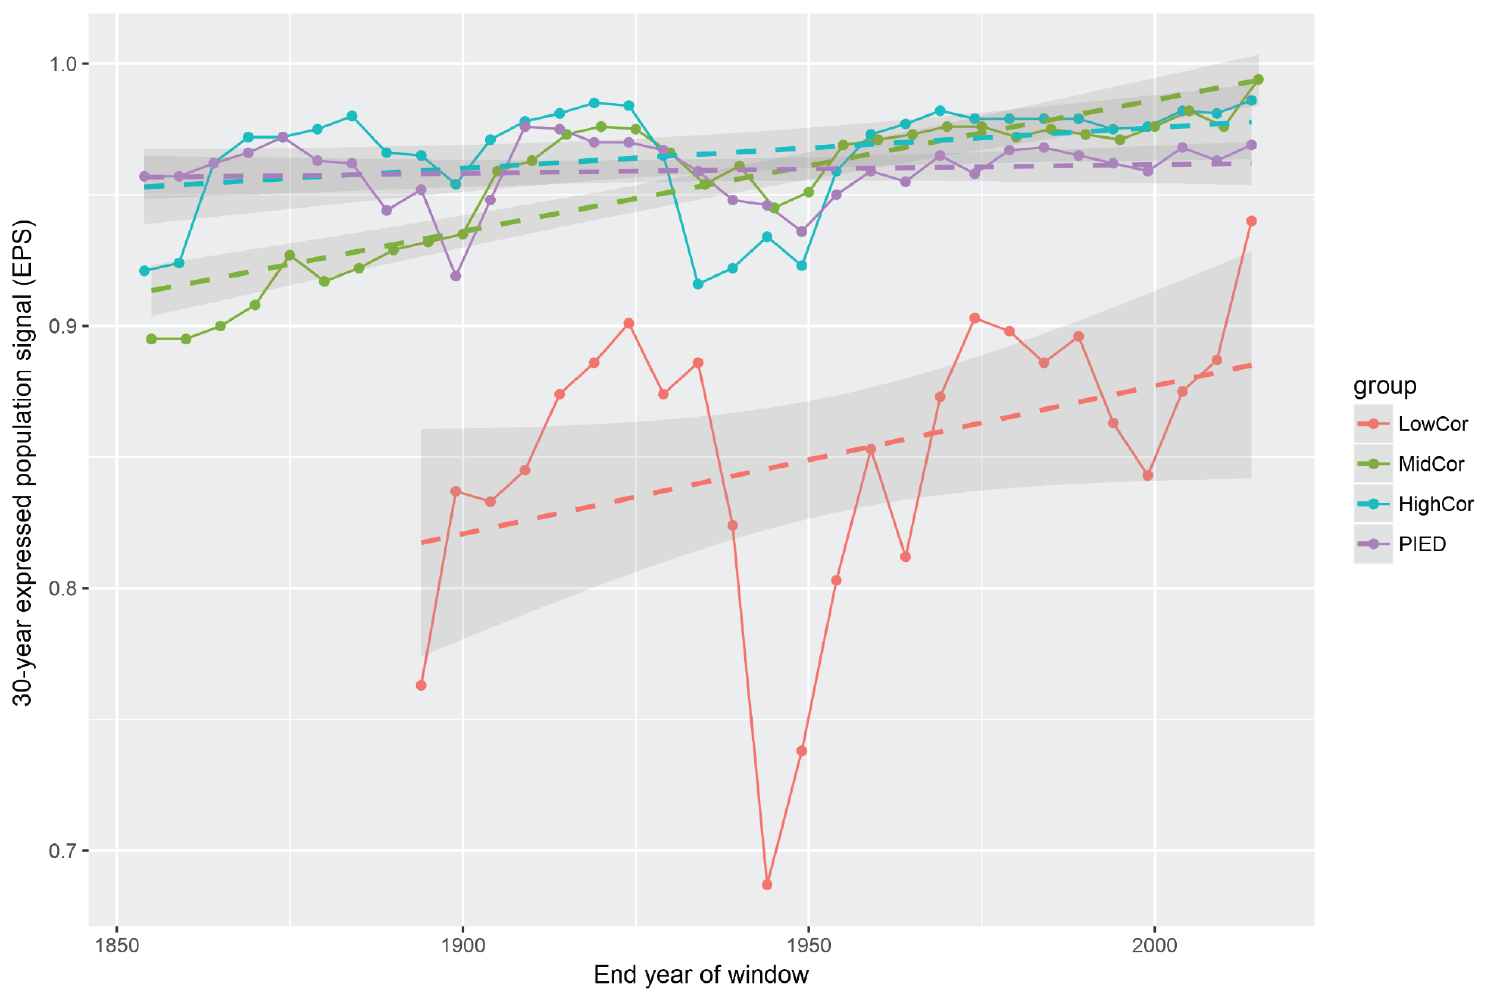
Figure 5.6: Comparison of growth synchrony among different groups of CFI plots. Solid lines show the running-window EPS values. Dotted lines represent linear regression of the patterns with shaded areas showing the 95% confidence interval around the regression.
In the second test of changing growth patterns, we found that the average growth variability (standard deviation) rapidly increased across the LowCor plots since about 1950 (Figure 5.7). This metric of growth variability corresponds to the strength of climate in driving tree growth, wherein higher standard deviations of tree growth are more climatically sensitive31. Growth variability across all CFI plots fluctuated over time, but no other group showed such a dramatic increase in standard deviation as that of the LowCor group in recent decades. Furthermore, the variability in growth at LowCor plots remained well below that of the other groups throughout the 1900s, but is now within the range of the MidCor and PIED groups. This change indicates that conditions for tree growth at the higher elevations of the Chuska Mountains are now somewhat equivalent to historical levels of the lower elevations.
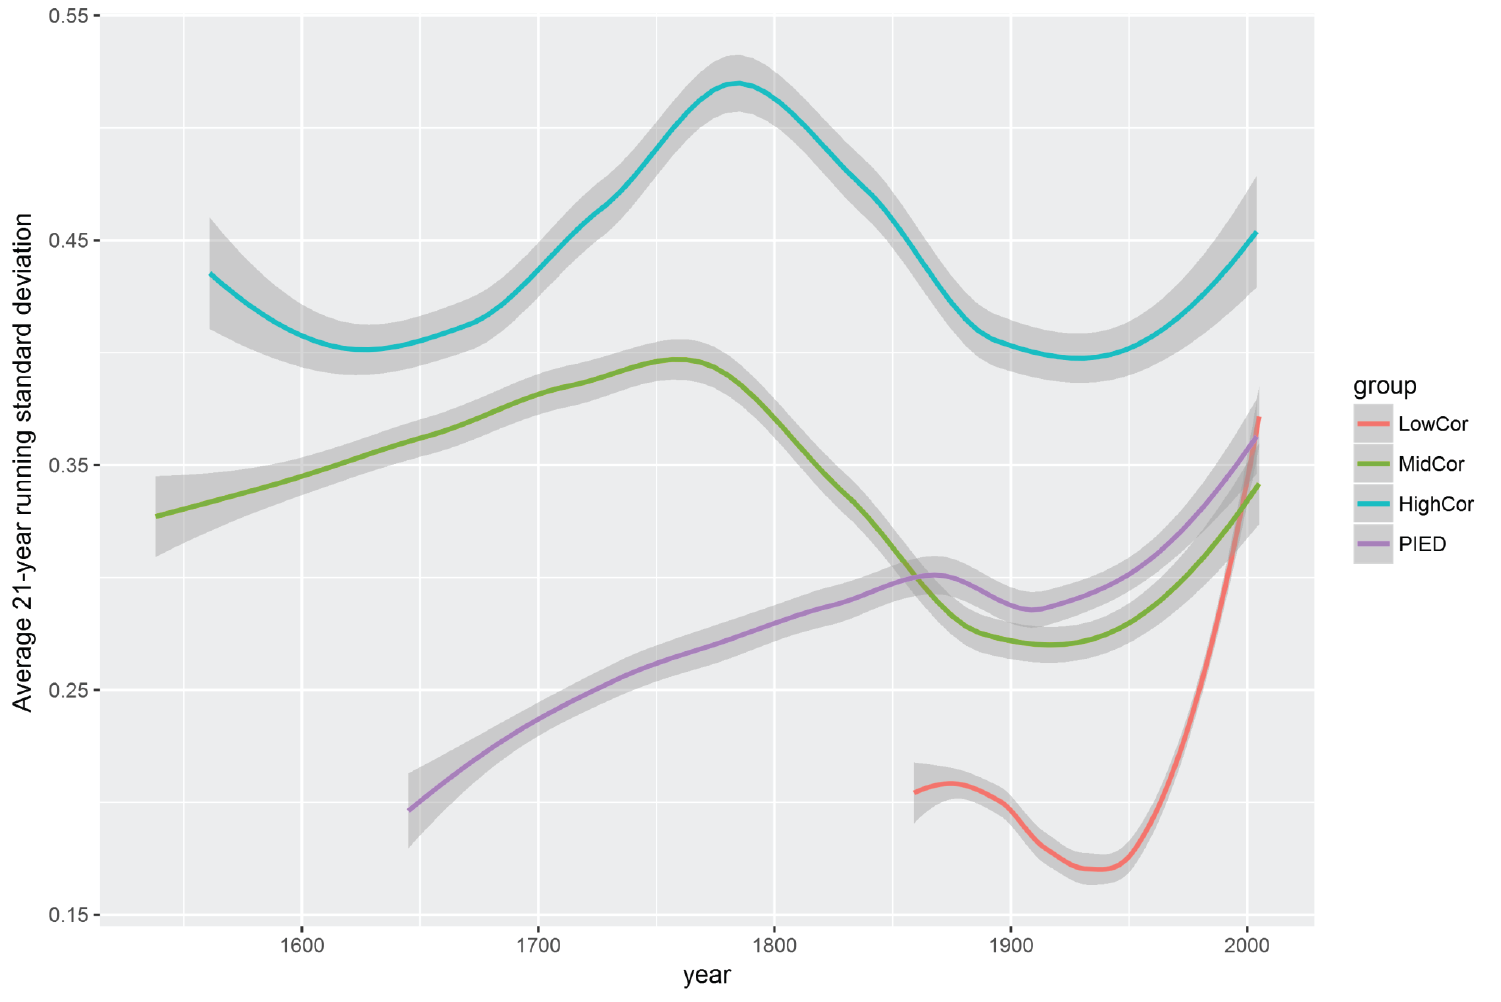
Figure 5.7: Smoothed trends in forest growth variability among the CFI plot groups. Shaded areas show the 95% confidence intervals.
5.3 Is tree growth declining in Navajo forests?
The changes in growth patterns above underscore changing conditions for trees driven by increased temperatures and recent ongoing drought. These growth indices, however, do not show notable declines in growth or productivity, just greater sensitivity to climate. To further test whether tree growth is in decline or not, we calculated absolute growth of the CFI trees (5.8). Basal area increment (BAI) is the amount of wood produced by a tree each year, presented here as the average level across each correlation group. Several aspects of BAI stand out. Growth among the PIED group is substantially lower than the other species, regardless of climate sensitivity or landscape position. Growth among the upper-elevation trees in the LowCor group is the highest overall, especially during the early part of the 20th century. It is only during recent major drought years such as 2002 that growth levels differ little across the groups. Although changes in the synchrony of growth (reduced shaded area) and variability in growth are apparent here for the LowCor group, there is not a downward trend in productivity. The LowCor group is experiencing greater climate sensitivity but is not yet in growth decline. Basal area growth between the HighCor and MidCor groups is nearly equal through time, and while recent drought years have resulted in near-zero growth rates, average BAI over the last decade or so is similar to other drought episodes such as the 1950s. This shows that the ongoing drought may be the longest period of reduced growth over at least the last century for HighCor and ModCor plots, it does not appear to signal a departure from normal drought response.
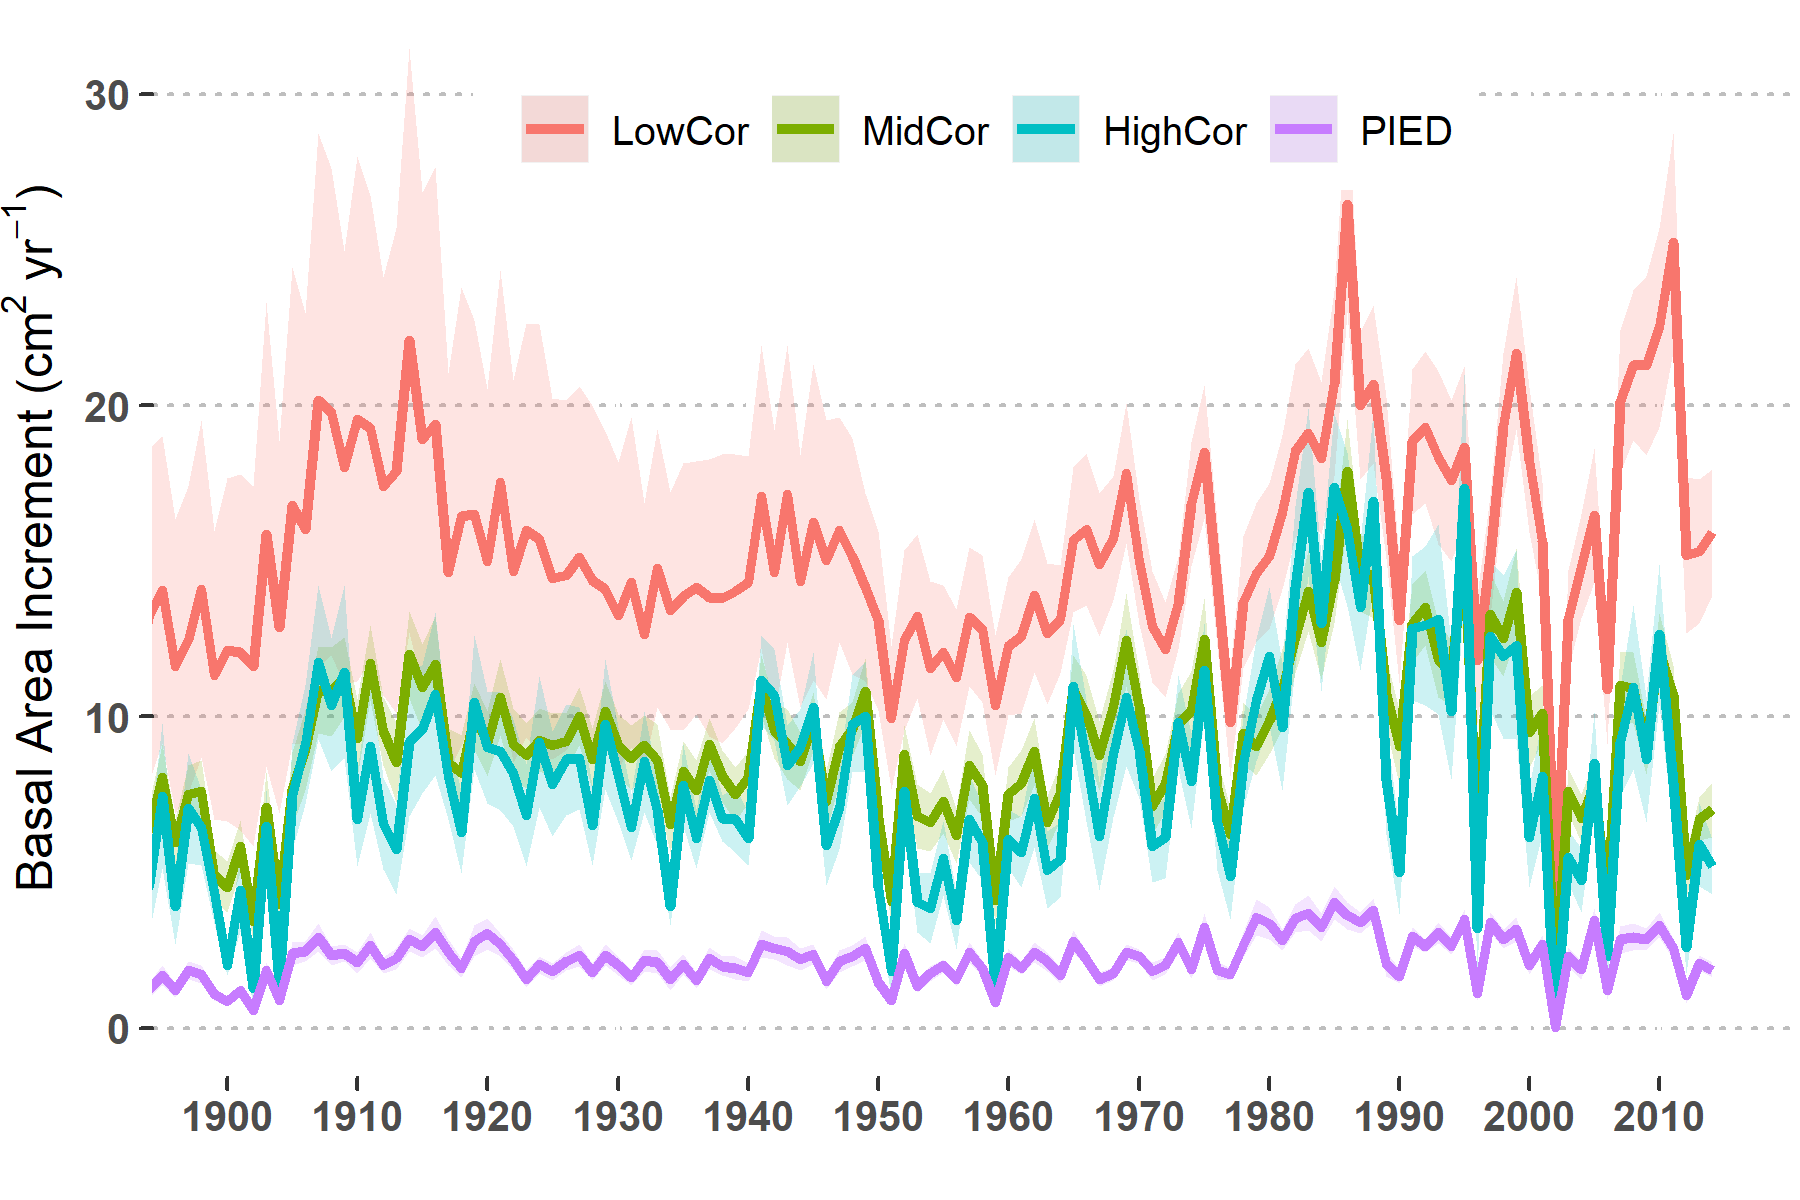
Figure 5.8: Annual basal area growth of trees averaged across CFI plots and correlation groups (See text and figures above for definitions). Shaded areas show the standard error for each group of plots.
5.4 Conclusions
Across the Navajo forest, we found substantial variability in the response of tree growth to climate. Across all CFI plots, climate plays a role in limiting soil moisture for growth, with lower-elevation areas such as the Defiance Plateau most highly regulated by climate. In general, upper-elevation sites composted of dry mixed conifer forests (mixed ponderosa pine and Douglas-fir) have the lowest sensitivity to climate. This is due to higher precipitation and lower temperatures on average that maintain sufficient soil moisture throughout the growing season.
Although lower elevation areas are highly sensitive to climate, we did not find strong evidence for declining growth over the warmer last few decades. Growth rates (BAI) were lower in the 2000s than they were in the 1980s, but we attribute this change to differences between a wet decade and dry one, with growth rates since the mid-1990s returning to close to the 20th century average.
An alarming trend that we found is the increasing level of climate sensitivity at the upper-elevation plots. This trend was quantified in two ways - growth synchrony and growth variability, and is notable in both standardized ring width indices and BAI. The changes indicate that upper-elevation trees, which were once buffered from drought episodes such as the 1950s, have recently exhibited the effects of drought due to rising temperatures since the mid-1980s. Rising temperatures appear to have begun to limit soil moisture during the growing season, making the trees more responsive to climate variability and winter precipitation than they probably ever were before. Although overall growth rates have not declined with these shifting climate sensitivity, it signals the potential for changes in the future. It also shows that climate change has progressed in a steady upward march in the Chuska Mountains, turning tree growth patterns at the upper-elevations into something akin to mid and lower elevations.
A component to alarm raised by these findings is the steady loss of landscape diversity in reponse to drought and disturbance. Climate change is making tree growth more homogeneous at the landscape-scale. Previously, when a drought or widespread disturbance (fire or insect outbreak) occurred, much of the area of the Navajo forest would be buffered from its effects by the resistance garnered from plentiful resources, especially water. The LowCor, upper-elevation plots represent ~20% of the Navajo forest. But now, hotter droughts have synchronized growth response closer to a level where landscape diversity may be lost. Disturbances may be able to affect much greater areas. Our findings thus indicate that climate change is reducing landscape variability in the resistance of trees to drought.
References
15. Williams, A. P. et al. Temperature as a potent driver of regional forest drought stress and tree mortality. Nature Climate Change 3, 292–297 (2013).
27. Williams, A. P. et al. Forest responses to increasing aridity and warmth in the southwestern United States. Proceedings of the National Academy of Sciences of the United States of America 107, 21289–94 (2010).
31. Klesse, S. et al. Sampling bias overestimates climate change impacts on forest growth in the southwestern United States. Nature Communications 9, 5336 (2018).
75. Restaino, C. M., Peterson, D. L. & Littell, J. Increased water deficit decreases Douglas fir growth throughout western US forests. Proceedings of the National Academy of Sciences 113, 9557–9562 (2016).
76. Charney, N. D. et al. Observed forest sensitivity to climate implies large changes in 21st century North American forest growth. Ecology Letters 19, 1119–1128 (2016).
20. Allen, C. D., Breshears, D. D. & McDowell, N. G. On underestimation of global vulnerability to tree mortality and forest die-off from hotter drought in the Anthropocene. Ecosphere 6, art129 (2015).
77. Ogle, K., Whitham, T. G. & Cobb, N. S. Tree-ring variation in pinyon predicts likelihood of death following severe drought. Ecology 81, 3237–3243 (2000).
78. Anderegg, W. R. L., Kane, J. M. & Anderegg, L. D. L. Consequences of widespread tree mortality triggered by drought and temperature stress. Nature Climate Change (2012). doi:10.1038/nclimate1635
79. St. George, S. An overview of tree-ring width records across the Northern Hemisphere. Quaternary Science Reviews 95, 132–150 (2014).
9. Breshears, D. D. et al. The critical amplifying role of increasing atmospheric moisture demand on tree mortality and associated regional die-off. Frontiers in plant science 4, 266 (2013).
80. Fritts, H. C., Smith, D. G., Cardis, J. W. & Budelsky, C. A. Tree-ring characteristics along a vegetation gradient in northern Arizona. Ecology 46, 393–401 (1965).
30. van Mantgem, P. J., Falk, D. A., Williams, E. C., Das, A. J. & Stephenson, N. L. Pre-fire drought and competition mediate post-fire conifer mortality in western U.S. National Parks. Ecological Applications 28, 1730–1739 (2018).
81. Macalady, A. K. & Bugmann, H. Growth-mortality relationships in pinon pine (Pinus edulis) during severe droughts of the past century: Shifting processes in space and time. PLoS ONE 9, (2014).