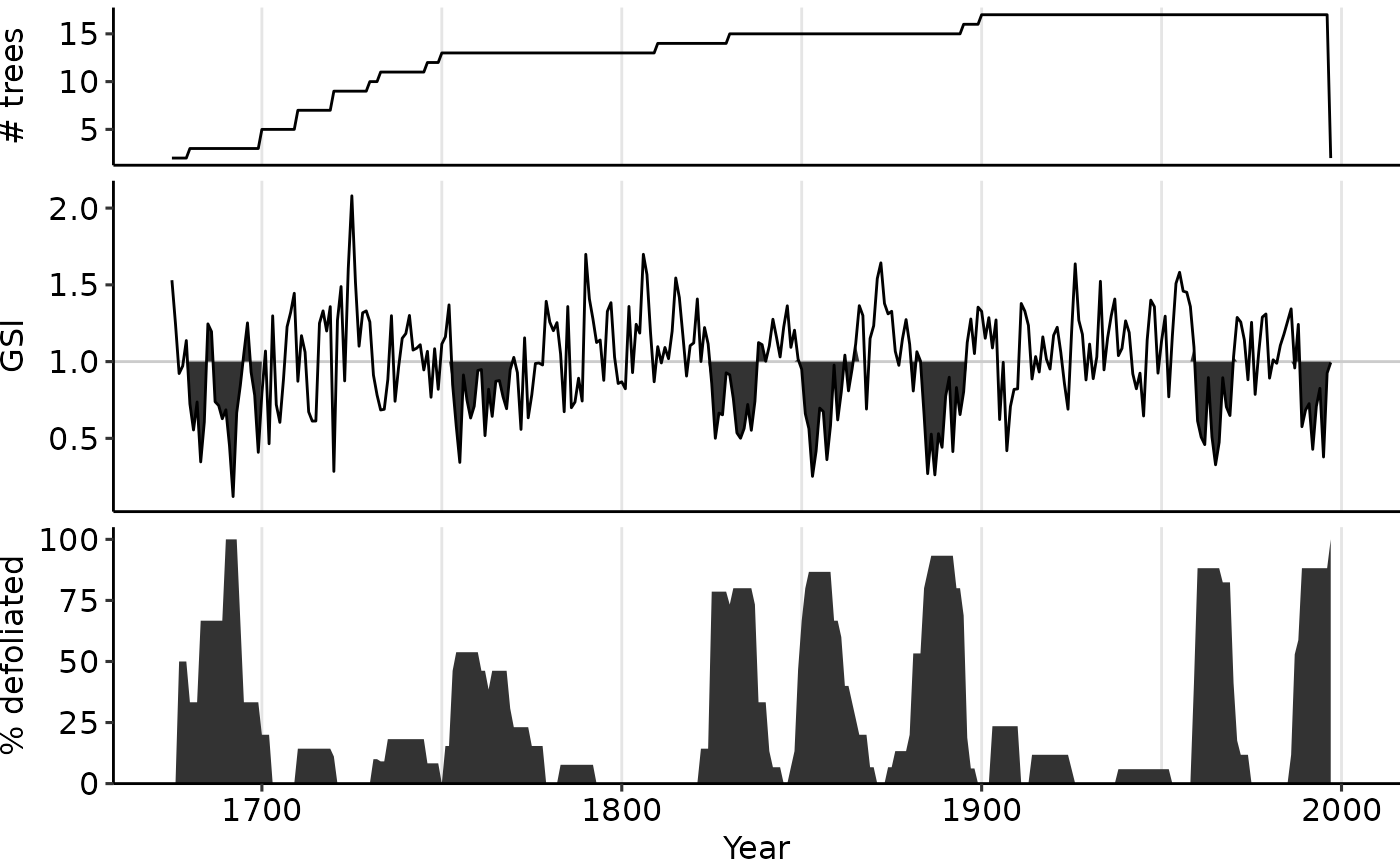
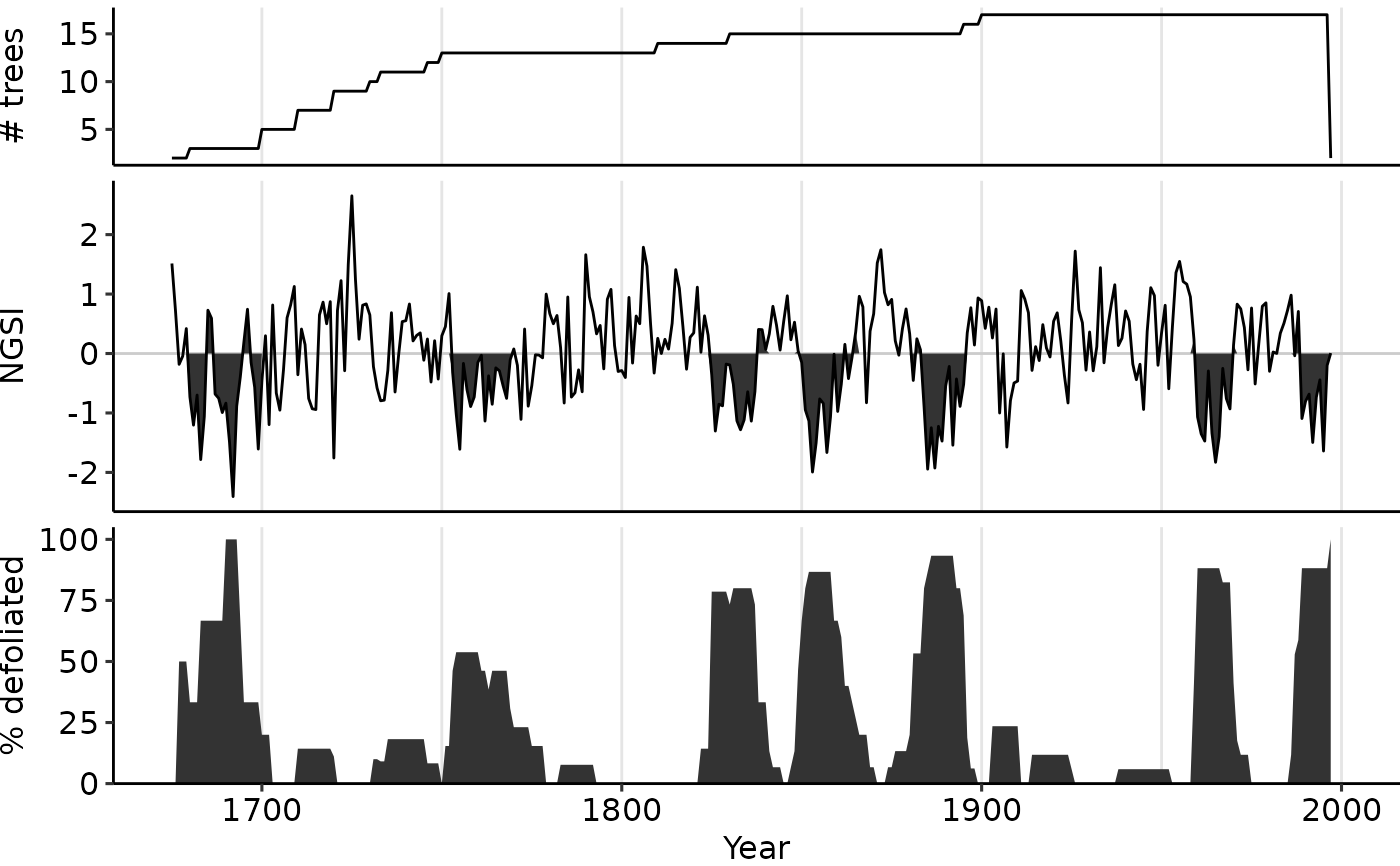
Produce a stacked plot to present composited, site-level insect outbreak chronologies
Source:R/plotting.R
plot_outbreak.RdProduce a stacked plot to present composited, site-level insect outbreak chronologies
Usage
plot_outbreak(x, disp_index = c("GSI", "NGSI"), label_defol = "% defoliated")Arguments
- x
an 'obr' object produced by
outbreak()- disp_index
Identify the timeseries index to plot. Defaults to
NGSI, the average normalized growth suppression index for the site. The only other option isGSI, the average growth suppression index.- label_defol
Allows users to change the bottom tile of the printed ouput to read what they'd like. Defaults to "% defoliated"
Examples
data(dmj_obr)
plot_outbreak(dmj_obr)


# Change middle panel display from the default "NGSI" to "GSI"
plot_outbreak(dmj_obr, disp_index = "GSI")
# Change middle panel display from the default "NGSI" to "GSI"
plot_outbreak(dmj_obr, disp_index = "GSI")