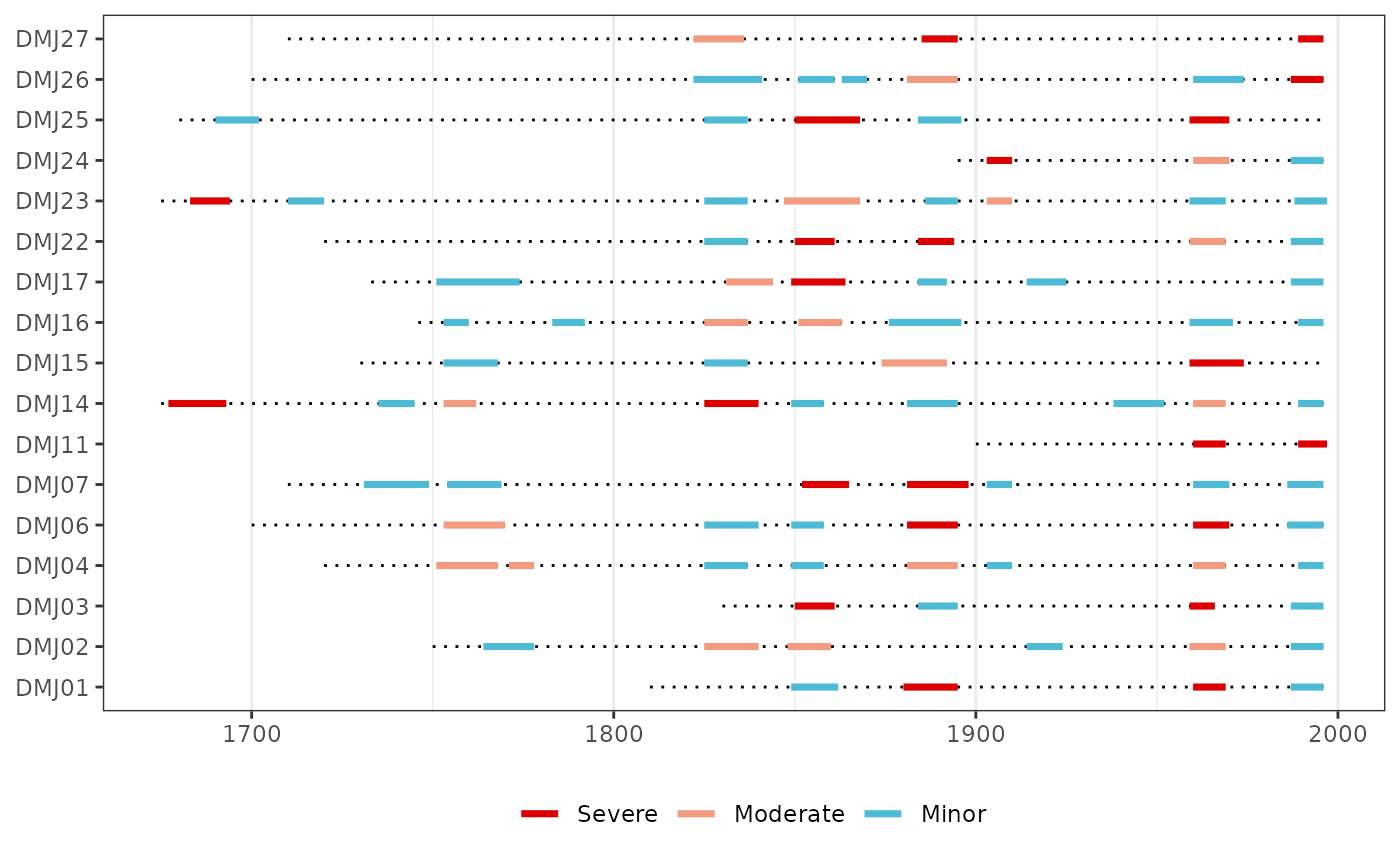
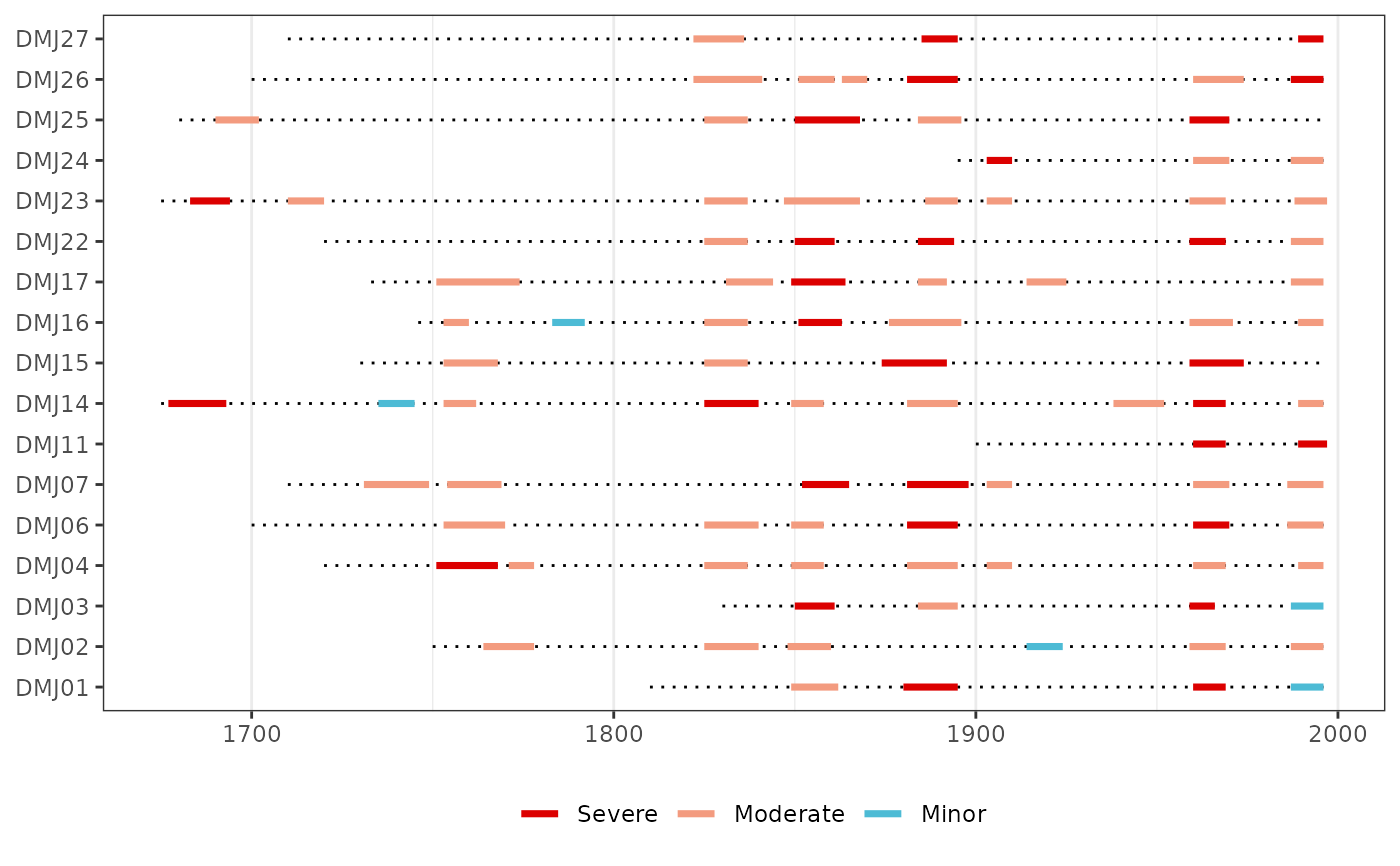
Produce a Gantt plot of individual tree-ring series to show defoliation events in time
Source:R/plotting.R
plot_defol.RdProduce a Gantt plot of individual tree-ring series to show defoliation events in time
Arguments
- x
a
defolobject produced bydefoliate_trees().- breaks
a vector length two providing threshold (negative)
ngsivalues to separate minor, moderate, and severe defoliation events. If blank, the mean and 1st quartile are used.